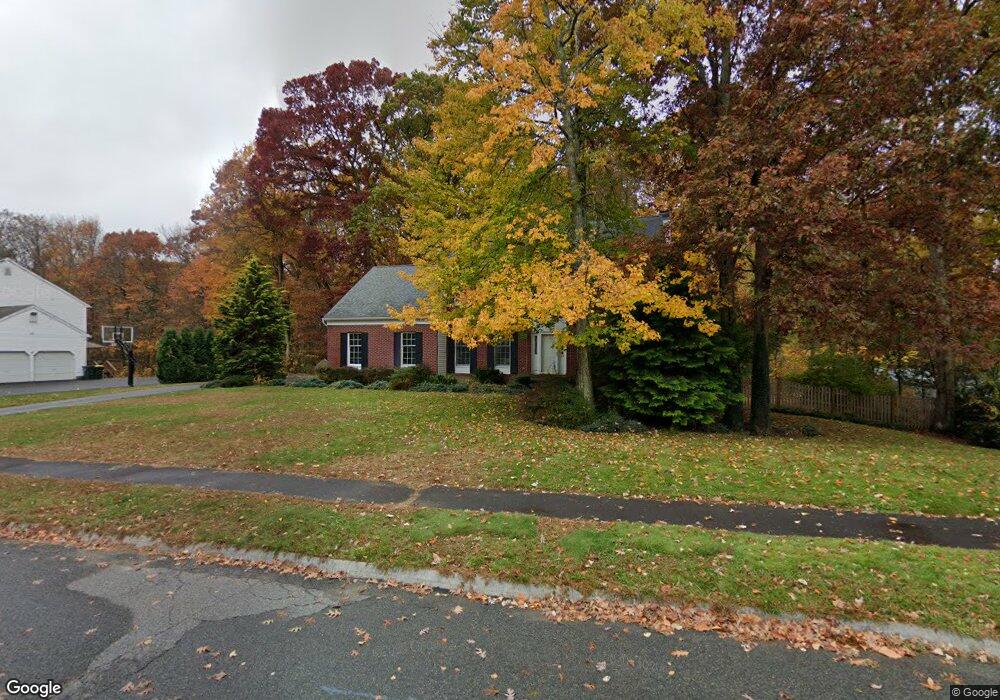
47 Charles River Dr Franklin, MA 02038
Estimated Value: $942,820 - $1,039,000
4
Beds
3
Baths
2,624
Sq Ft
$376/Sq Ft
Est. Value
About This Home
This home is located at 47 Charles River Dr, Franklin, MA 02038 and is currently estimated at $986,205, approximately $375 per square foot. 47 Charles River Dr is a home located in Norfolk County with nearby schools including Oak Street Elementary School, Horace Mann Middle School, and Franklin High School.
Ownership History
Date
Name
Owned For
Owner Type
Purchase Details
Closed on
Jan 21, 2022
Sold by
Cirotski 2013 Ft and Cirotski
Bought by
Giannetto Jennifer L
Current Estimated Value
Purchase Details
Closed on
Sep 19, 2018
Sold by
Cirotski Betty B
Bought by
Cirotski Ft 2013 and Cirotski
Purchase Details
Closed on
Mar 17, 2000
Sold by
Giannetto James J and Giannetto Jennifer L
Bought by
Cirotski Leo G and Cirotski Betty B
Purchase Details
Closed on
Aug 23, 1994
Sold by
Franklin Farms Lp
Bought by
Giannetto James J and Giannetto Jennifer L
Home Financials for this Owner
Home Financials are based on the most recent Mortgage that was taken out on this home.
Original Mortgage
$203,150
Interest Rate
8.61%
Mortgage Type
Purchase Money Mortgage
Create a Home Valuation Report for This Property
The Home Valuation Report is an in-depth analysis detailing your home's value as well as a comparison with similar homes in the area
Home Values in the Area
Average Home Value in this Area
Purchase History
| Date | Buyer | Sale Price | Title Company |
|---|---|---|---|
| Giannetto Jennifer L | -- | None Available | |
| Cirotski Ft 2013 | -- | -- | |
| Cirotski Leo G | $311,000 | -- | |
| Giannetto James J | $280,082 | -- | |
| Giannetto James J | $280,082 | -- |
Source: Public Records
Mortgage History
| Date | Status | Borrower | Loan Amount |
|---|---|---|---|
| Previous Owner | Giannetto James J | $203,150 |
Source: Public Records
Tax History Compared to Growth
Tax History
| Year | Tax Paid | Tax Assessment Tax Assessment Total Assessment is a certain percentage of the fair market value that is determined by local assessors to be the total taxable value of land and additions on the property. | Land | Improvement |
|---|---|---|---|---|
| 2025 | $9,093 | $782,500 | $368,100 | $414,400 |
| 2024 | $9,226 | $782,500 | $368,100 | $414,400 |
| 2023 | $9,036 | $718,300 | $341,500 | $376,800 |
| 2022 | $8,814 | $627,300 | $294,500 | $332,800 |
| 2021 | $8,392 | $572,800 | $282,300 | $290,500 |
| 2020 | $8,149 | $561,600 | $285,100 | $276,500 |
| 2019 | $8,191 | $558,700 | $282,300 | $276,400 |
| 2018 | $7,732 | $527,800 | $279,400 | $248,400 |
| 2017 | $7,821 | $536,400 | $288,000 | $248,400 |
| 2016 | $7,276 | $501,800 | $249,300 | $252,500 |
| 2015 | $7,316 | $493,000 | $240,500 | $252,500 |
| 2014 | $6,838 | $473,200 | $220,700 | $252,500 |
Source: Public Records
Map
Nearby Homes
- 336 Maple St
- 41 Kimberlee Ave
- 208 Irondequoit Rd
- 2 Kayla Dr
- 2 Noanet Brook Ln
- 159 Highwood Dr
- 66 Highwood Dr
- 60 Southgate Rd
- 2211 Franklin Crossing Rd Unit 2211
- 83 Highwood Dr Unit 83
- 1805 Franklin Crossing Rd
- 31 Highwood Dr
- 605 Franklin Crossing Rd
- 204 Lincoln St
- 57 Raymond St Unit 2
- 17 Longhill Rd
- 48 Pinehurst St
- 14 Pleasant St Unit A
- 6 Buena Vista Dr
- 0 Upper Union St Unit 73230551
- 45 Charles River Dr
- 49 Charles River Dr
- 44 Charles River Dr
- 82 Charles River Dr
- 43 Charles River Dr
- 46 Charles River Dr
- 51 Charles River Dr
- 40 Charles River Dr
- 70 Charles River Dr
- 81 Charles River Dr
- 41 Charles River Dr
- 48 Charles River Dr
- 53 Charles River Dr
- 68 Charles River Dr
- 38 Charles River Dr
- 80 Charles River Dr
- 10 Franklin Springs Rd
- 10 Franklin Springs Rd Unit 11-10
- 50 Charles River Dr
- 39 Charles River Dr