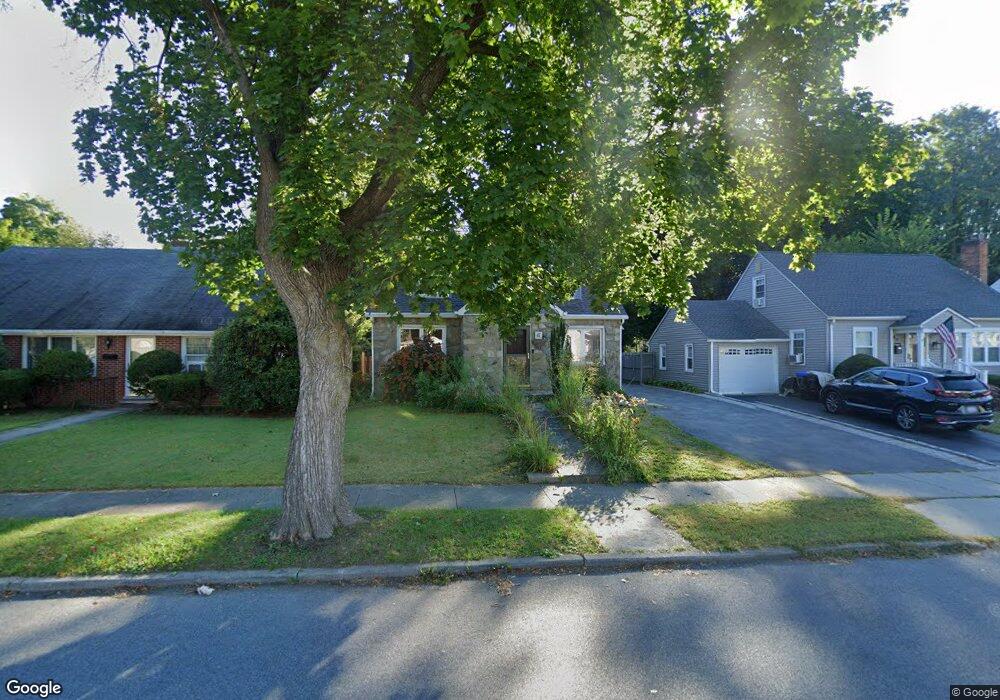
47 Fountain Place Poughkeepsie, NY 12603
Estimated Value: $363,000 - $453,000
5
Beds
2
Baths
2,778
Sq Ft
$142/Sq Ft
Est. Value
About This Home
This home is located at 47 Fountain Place, Poughkeepsie, NY 12603 and is currently estimated at $395,327, approximately $142 per square foot. 47 Fountain Place is a home located in Dutchess County with nearby schools including Poughkeepsie High School, Holy Trinity School, and Poughkeepsie Community Seventh-Day Adventist School.
Ownership History
Date
Name
Owned For
Owner Type
Purchase Details
Closed on
Jan 25, 2017
Sold by
U S Bank National Associa
Bought by
Us Bank National Associat
Current Estimated Value
Purchase Details
Closed on
Jan 13, 2016
Sold by
Roman Ismael
Bought by
U S Bank National Associa
Purchase Details
Closed on
Mar 15, 2007
Sold by
Roman Ismael
Bought by
Roman Ismael
Purchase Details
Closed on
Dec 12, 2005
Sold by
Incorvaia Vincenzo
Bought by
Roman Ismael
Purchase Details
Closed on
Oct 10, 2002
Sold by
Incorvaia Vincenzo
Bought by
Incorvaia Vincenzo
Purchase Details
Closed on
Feb 23, 2001
Purchase Details
Closed on
Nov 3, 2000
Sold by
Tegtmeier Jack A
Bought by
Incorvaia Vincenzo F
Create a Home Valuation Report for This Property
The Home Valuation Report is an in-depth analysis detailing your home's value as well as a comparison with similar homes in the area
Home Values in the Area
Average Home Value in this Area
Purchase History
| Date | Buyer | Sale Price | Title Company |
|---|---|---|---|
| Us Bank National Associat | $273,928 | -- | |
| U S Bank National Associa | $273,928 | -- | |
| Roman Ismael | -- | -- | |
| Roman Ismael | $292,000 | -- | |
| Incorvaia Vincenzo | -- | -- | |
| -- | -- | -- | |
| Incorvaia Vincenzo F | $110,500 | Frank Redl |
Source: Public Records
Tax History Compared to Growth
Tax History
| Year | Tax Paid | Tax Assessment Tax Assessment Total Assessment is a certain percentage of the fair market value that is determined by local assessors to be the total taxable value of land and additions on the property. | Land | Improvement |
|---|---|---|---|---|
| 2024 | $8,078 | $319,400 | $59,400 | $260,000 |
| 2023 | $7,515 | $301,300 | $59,400 | $241,900 |
| 2022 | $6,341 | $251,100 | $54,000 | $197,100 |
| 2021 | $6,167 | $207,500 | $54,000 | $153,500 |
| 2020 | $5,946 | $172,900 | $54,000 | $118,900 |
| 2019 | $5,771 | $157,200 | $54,000 | $103,200 |
| 2018 | $5,245 | $149,700 | $54,000 | $95,700 |
| 2017 | $5,603 | $142,600 | $54,000 | $88,600 |
| 2016 | $7,031 | $147,000 | $54,000 | $93,000 |
| 2015 | -- | $147,000 | $54,000 | $93,000 |
| 2014 | -- | $147,000 | $54,000 | $93,000 |
Source: Public Records
Map
Nearby Homes
- 63 Manitou Ave
- 31 Worrall Ave
- 65 Worrall Ave
- 59 S Grand Ave
- 64 Glenwood Ave
- 1 Gray St
- 10 Fox Terrace
- 66 Glenwood Ave
- 24 Jewett Ave
- 29 Lewis Ave
- 19 Lewis Ave
- 9 Glenwood Ave
- 115 Fulton Ave
- 324-326 Church St
- 6 Glenwood Ave
- 13 Parkview Terrace
- 23 Musselman Dr
- 108 Winnikee Ave
- 21 Forbus St
- 95 S Grand Ave
- 45 Fountain Place
- 49 Fountain Place
- 43 Fountain Place
- 51 Fountain Place
- 41 Fountain Place
- 53 Fountain Place
- 48 Fountain Place
- 50 Fountain Place
- 46 Fountain Place
- 44 Fountain Place
- 55 Fountain Place
- 54 Fountain Place
- 42 Fountain Place
- 42 Fountain Place
- 57 Fountain Place
- 56 Fountain Place
- 49 Manitou Ave
- 48 Worrall Ave
- 51 Manitou Ave
- 36 Fountain Place