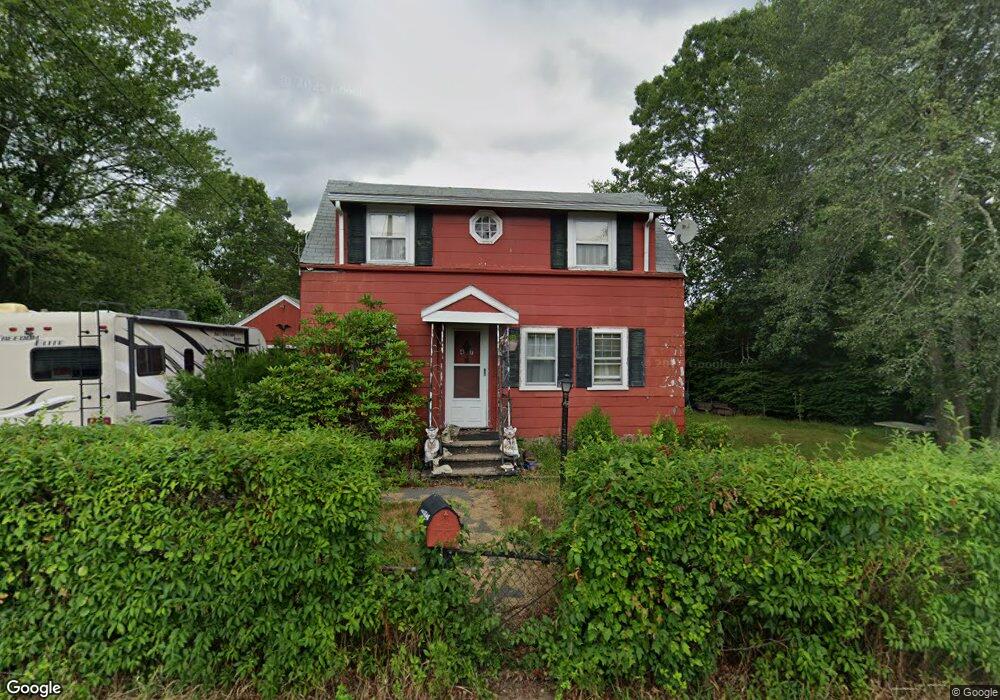
47 Gold St Randolph, MA 02368
North Randolph NeighborhoodEstimated Value: $447,000 - $532,911
2
Beds
1
Bath
988
Sq Ft
$493/Sq Ft
Est. Value
About This Home
This home is located at 47 Gold St, Randolph, MA 02368 and is currently estimated at $487,228, approximately $493 per square foot. 47 Gold St is a home located in Norfolk County with nearby schools including Randolph High School, Boston Higashi School, and Lighthouse Baptist Christian Academy.
Ownership History
Date
Name
Owned For
Owner Type
Purchase Details
Closed on
Jun 12, 2017
Sold by
Perotti Dorothy R
Bought by
Fernandes 3Rd James
Current Estimated Value
Home Financials for this Owner
Home Financials are based on the most recent Mortgage that was taken out on this home.
Original Mortgage
$198,600
Outstanding Balance
$165,239
Interest Rate
4.03%
Mortgage Type
New Conventional
Estimated Equity
$321,989
Purchase Details
Closed on
Apr 30, 1969
Bought by
Sylva Dorothy R and Chambers Dorothy J
Create a Home Valuation Report for This Property
The Home Valuation Report is an in-depth analysis detailing your home's value as well as a comparison with similar homes in the area
Home Values in the Area
Average Home Value in this Area
Purchase History
| Date | Buyer | Sale Price | Title Company |
|---|---|---|---|
| Fernandes 3Rd James | $220,000 | -- | |
| Sylva Dorothy R | -- | -- |
Source: Public Records
Mortgage History
| Date | Status | Borrower | Loan Amount |
|---|---|---|---|
| Open | Fernandes 3Rd James | $198,600 |
Source: Public Records
Tax History Compared to Growth
Tax History
| Year | Tax Paid | Tax Assessment Tax Assessment Total Assessment is a certain percentage of the fair market value that is determined by local assessors to be the total taxable value of land and additions on the property. | Land | Improvement |
|---|---|---|---|---|
| 2025 | $5,314 | $457,700 | $268,700 | $189,000 |
| 2024 | $5,202 | $454,300 | $263,700 | $190,600 |
| 2023 | $4,879 | $403,900 | $239,600 | $164,300 |
| 2022 | $4,632 | $340,600 | $199,900 | $140,700 |
| 2021 | $4,316 | $292,000 | $167,300 | $124,700 |
| 2020 | $4,254 | $285,300 | $167,300 | $118,000 |
| 2019 | $4,081 | $272,400 | $159,500 | $112,900 |
| 2018 | $3,830 | $241,200 | $145,500 | $95,700 |
| 2017 | $3,838 | $237,200 | $138,700 | $98,500 |
| 2016 | $3,728 | $214,400 | $126,100 | $88,300 |
| 2015 | $3,618 | $199,900 | $120,300 | $79,600 |
Source: Public Records
Map
Nearby Homes
- 79 Gold St
- 68 High St
- 43 Emily Jeffers Rd
- 229 Chestnut St
- 2 Smith Rd
- 33 Michael Rd
- 10 Michael Rd
- 902 Irving Rd Unit 902
- 51 Himoor Cir
- 232 Canton St Unit 104
- 232 Canton St Unit 112
- 20 Simmonds Blvd Unit 20
- 14 Simmonds Blvd Unit 14
- 12 Simmonds Blvd Unit 12
- 17 Mazzeo Dr
- 304 High St
- 34 Orchard St
- 591 N Main St
- 18 Jasper Ln
- 54 Jasper Ln