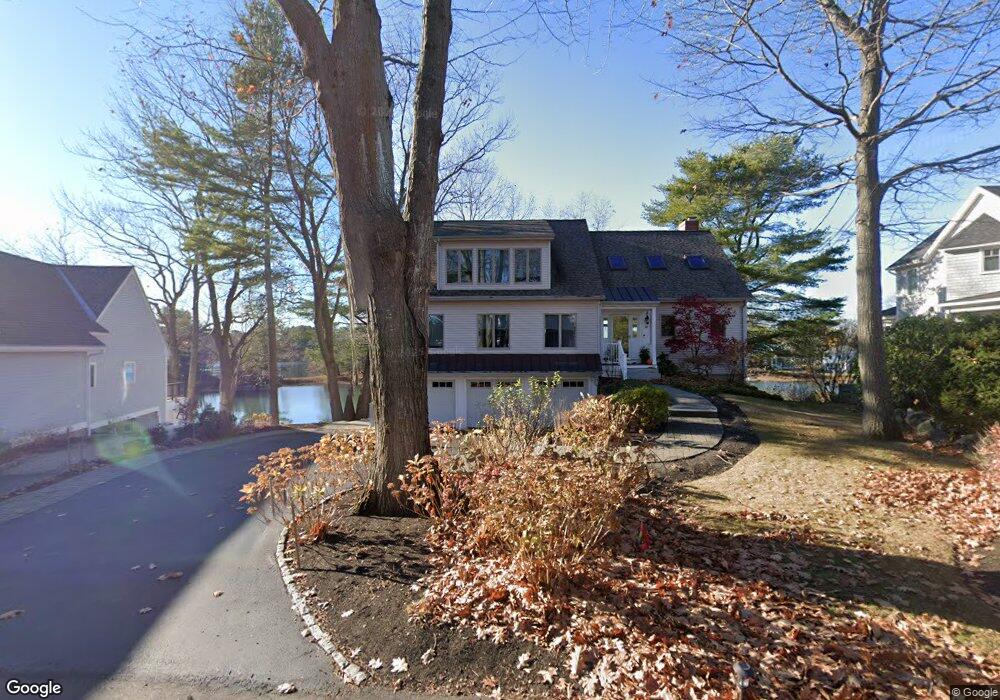
47 Locke Rd New Castle, NH 03854
New Castle Island NeighborhoodEstimated Value: $3,153,540 - $4,463,000
5
Beds
5
Baths
3,745
Sq Ft
$1,004/Sq Ft
Est. Value
About This Home
This home is located at 47 Locke Rd, New Castle, NH 03854 and is currently estimated at $3,760,180, approximately $1,004 per square foot. 47 Locke Rd is a home with nearby schools including Maude H. Trefethen School.
Ownership History
Date
Name
Owned For
Owner Type
Purchase Details
Closed on
Jul 11, 2013
Sold by
Jacobs Mark I
Bought by
Mark I Jacobs Ret
Current Estimated Value
Home Financials for this Owner
Home Financials are based on the most recent Mortgage that was taken out on this home.
Original Mortgage
$793,000
Outstanding Balance
$574,427
Interest Rate
3.83%
Mortgage Type
New Conventional
Estimated Equity
$3,185,753
Purchase Details
Closed on
Apr 22, 2005
Sold by
Hoffman Walter E
Bought by
Jacobs Mark I and Jacobs Alissa G
Home Financials for this Owner
Home Financials are based on the most recent Mortgage that was taken out on this home.
Original Mortgage
$815,000
Interest Rate
5.87%
Create a Home Valuation Report for This Property
The Home Valuation Report is an in-depth analysis detailing your home's value as well as a comparison with similar homes in the area
Home Values in the Area
Average Home Value in this Area
Purchase History
| Date | Buyer | Sale Price | Title Company |
|---|---|---|---|
| Mark I Jacobs Ret | -- | -- | |
| Jacobs Mark I | $1,275,000 | -- |
Source: Public Records
Mortgage History
| Date | Status | Borrower | Loan Amount |
|---|---|---|---|
| Open | Mark I Jacobs Ret | $793,000 | |
| Previous Owner | Jacobs Mark I | $815,000 |
Source: Public Records
Tax History Compared to Growth
Tax History
| Year | Tax Paid | Tax Assessment Tax Assessment Total Assessment is a certain percentage of the fair market value that is determined by local assessors to be the total taxable value of land and additions on the property. | Land | Improvement |
|---|---|---|---|---|
| 2024 | $15,194 | $2,818,900 | $2,210,500 | $608,400 |
| 2023 | $14,038 | $2,818,900 | $2,210,500 | $608,400 |
| 2022 | $12,310 | $2,735,500 | $2,210,500 | $525,000 |
| 2021 | $13,076 | $2,735,500 | $2,210,500 | $525,000 |
| 2020 | $11,504 | $1,826,100 | $1,432,200 | $393,900 |
| 2019 | $10,031 | $1,826,100 | $1,432,200 | $393,900 |
| 2018 | $10,957 | $1,826,100 | $1,432,200 | $393,900 |
| 2016 | $5,968 | $1,826,100 | $1,432,200 | $393,900 |
| 2015 | $9,444 | $1,475,700 | $1,072,900 | $402,800 |
| 2014 | $9,709 | $1,471,000 | $1,072,900 | $398,100 |
| 2013 | $9,400 | $1,471,000 | $1,072,900 | $398,100 |
Source: Public Records
Map
Nearby Homes
- 18 Mainmast Cir
- 14 Colonial Ln
- 57 Old Bay Rd
- 175 Wentworth Rd
- 17 Elm Ct
- 15 Atkinson St
- 24 Seabreeze Ln
- 167 Little Harbor Rd
- 163 Little Harbor Rd
- 205 Whipple Rd
- 112 Wentworth Rd
- 116 Whipple Rd
- 325 Marcy St
- 12 Gillis Dr Unit 3
- 72 Pepperrell Rd
- 112 Mechanic St
- 210 South St
- 33 Gardner St
- 405 Pleasant St
- 137 Walker Bungalow Rd