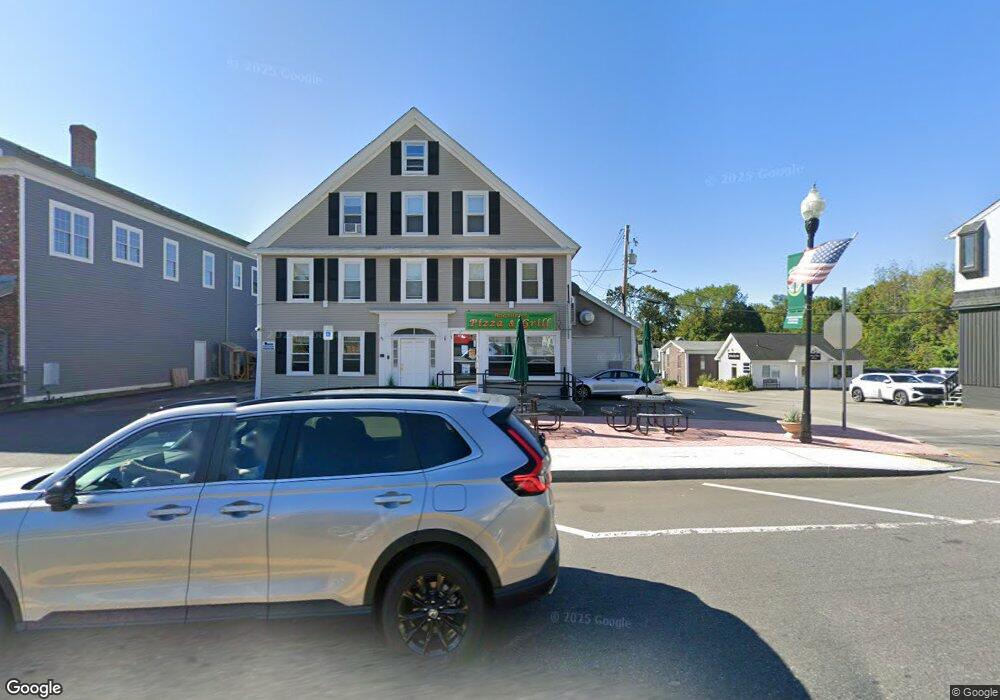
47 Main St Ashburnham, MA 01430
Estimated Value: $503,332
Studio
--
Bath
3,194
Sq Ft
$158/Sq Ft
Est. Value
About This Home
This home is located at 47 Main St, Ashburnham, MA 01430 and is currently estimated at $503,332, approximately $157 per square foot. 47 Main St is a home located in Worcester County with nearby schools including Oakmont Regional High School and Cushing Academy.
Ownership History
Date
Name
Owned For
Owner Type
Purchase Details
Closed on
Feb 29, 2016
Sold by
Kakavitsas John
Bought by
N & I Properties Llc
Current Estimated Value
Home Financials for this Owner
Home Financials are based on the most recent Mortgage that was taken out on this home.
Original Mortgage
$175,000
Outstanding Balance
$138,999
Interest Rate
3.92%
Mortgage Type
Commercial
Estimated Equity
$364,333
Purchase Details
Closed on
Apr 8, 2010
Sold by
Kakavitsas Paul
Bought by
Kakavitsas John
Purchase Details
Closed on
Jan 2, 2003
Sold by
Peterborough Oil Co In
Bought by
Kakavitsas John and Kakavitsas Paul
Home Financials for this Owner
Home Financials are based on the most recent Mortgage that was taken out on this home.
Original Mortgage
$250,000
Interest Rate
6.08%
Mortgage Type
Commercial
Create a Home Valuation Report for This Property
The Home Valuation Report is an in-depth analysis detailing your home's value as well as a comparison with similar homes in the area
Home Values in the Area
Average Home Value in this Area
Purchase History
| Date | Buyer | Sale Price | Title Company |
|---|---|---|---|
| N & I Properties Llc | $250,000 | -- | |
| N & I Properties Llc | $250,000 | -- | |
| Kakavitsas John | -- | -- | |
| Kakavitsas John | -- | -- | |
| Kakavitsas John | $250,000 | -- | |
| Kakavitsas John | $250,000 | -- |
Source: Public Records
Mortgage History
| Date | Status | Borrower | Loan Amount |
|---|---|---|---|
| Open | N & I Properties Llc | $175,000 | |
| Closed | N & I Properties Llc | $175,000 | |
| Previous Owner | Kakavitsas John | $250,000 |
Source: Public Records
Tax History
| Year | Tax Paid | Tax Assessment Tax Assessment Total Assessment is a certain percentage of the fair market value that is determined by local assessors to be the total taxable value of land and additions on the property. | Land | Improvement |
|---|---|---|---|---|
| 2025 | $3,906 | $262,700 | $43,000 | $219,700 |
| 2024 | $4,161 | $264,200 | $43,000 | $221,200 |
| 2023 | $4,359 | $263,400 | $43,000 | $220,400 |
| 2022 | $4,839 | $256,300 | $43,000 | $213,300 |
| 2021 | $4,860 | $236,500 | $43,000 | $193,500 |
| 2020 | $4,754 | $236,500 | $43,000 | $193,500 |
| 2019 | $3,917 | $236,500 | $43,000 | $193,500 |
| 2018 | $5,485 | $234,400 | $40,900 | $193,500 |
| 2017 | $3,551 | $193,700 | $53,000 | $140,700 |
| 2016 | $4,334 | $190,500 | $52,000 | $138,500 |
| 2015 | $4,244 | $190,500 | $52,000 | $138,500 |
Source: Public Records
Map
Nearby Homes
Your Personal Tour Guide
Ask me questions while you tour the home.