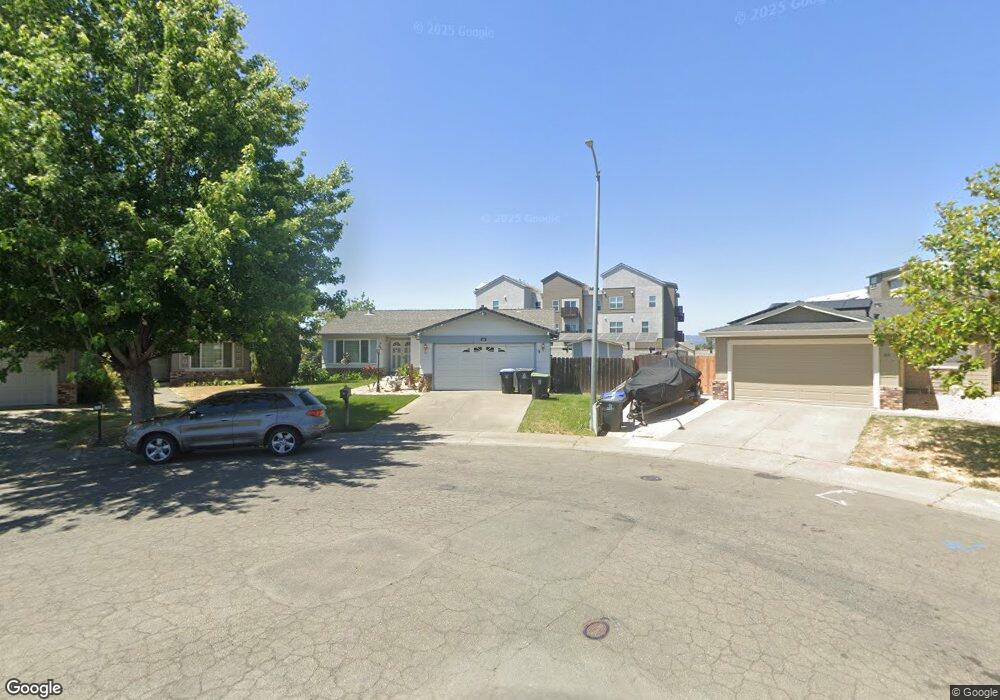
47 Montego Ct Suisun City, CA 94585
Estimated Value: $473,097 - $538,000
3
Beds
2
Baths
1,384
Sq Ft
$365/Sq Ft
Est. Value
About This Home
This home is located at 47 Montego Ct, Suisun City, CA 94585 and is currently estimated at $505,024, approximately $364 per square foot. 47 Montego Ct is a home located in Solano County with nearby schools including Crescent Elementary School, Crystal Middle School, and Armijo High School.
Ownership History
Date
Name
Owned For
Owner Type
Purchase Details
Closed on
Aug 18, 2010
Sold by
Scrogings Jack and Scrogings Evelyn
Bought by
The Scrogings Living Trust and Scrogings Jack
Current Estimated Value
Home Financials for this Owner
Home Financials are based on the most recent Mortgage that was taken out on this home.
Original Mortgage
$128,800
Interest Rate
4.51%
Mortgage Type
New Conventional
Purchase Details
Closed on
Aug 18, 2008
Sold by
Scrogings Jack and Brown Evelyn
Bought by
Scrogings Jack and Brown Evelyn Scrogings
Purchase Details
Closed on
Aug 10, 2007
Sold by
Scrogings Jack
Bought by
Scrogings Jack and Brown Evelyn
Create a Home Valuation Report for This Property
The Home Valuation Report is an in-depth analysis detailing your home's value as well as a comparison with similar homes in the area
Home Values in the Area
Average Home Value in this Area
Purchase History
| Date | Buyer | Sale Price | Title Company |
|---|---|---|---|
| The Scrogings Living Trust | -- | First American Title Lenders | |
| Scrogings Jack | -- | None Available | |
| Scrogings Jack | -- | None Available |
Source: Public Records
Mortgage History
| Date | Status | Borrower | Loan Amount |
|---|---|---|---|
| Previous Owner | The Scrogings Living Trust | $128,800 |
Source: Public Records
Tax History Compared to Growth
Tax History
| Year | Tax Paid | Tax Assessment Tax Assessment Total Assessment is a certain percentage of the fair market value that is determined by local assessors to be the total taxable value of land and additions on the property. | Land | Improvement |
|---|---|---|---|---|
| 2025 | $1,318 | $115,812 | $36,231 | $79,581 |
| 2024 | $1,318 | $113,542 | $35,521 | $78,021 |
| 2023 | $1,278 | $111,317 | $34,825 | $76,492 |
| 2022 | $1,185 | $109,136 | $34,144 | $74,992 |
| 2021 | $1,172 | $106,997 | $33,475 | $73,522 |
| 2020 | $1,144 | $105,901 | $33,132 | $72,769 |
| 2019 | $1,114 | $103,826 | $32,483 | $71,343 |
| 2018 | $1,159 | $101,792 | $31,847 | $69,945 |
| 2017 | $1,106 | $99,797 | $31,223 | $68,574 |
| 2016 | $1,089 | $97,841 | $30,611 | $67,230 |
| 2015 | $1,016 | $96,373 | $30,152 | $66,221 |
| 2014 | $1,008 | $94,486 | $29,562 | $64,924 |
Source: Public Records
Map
Nearby Homes