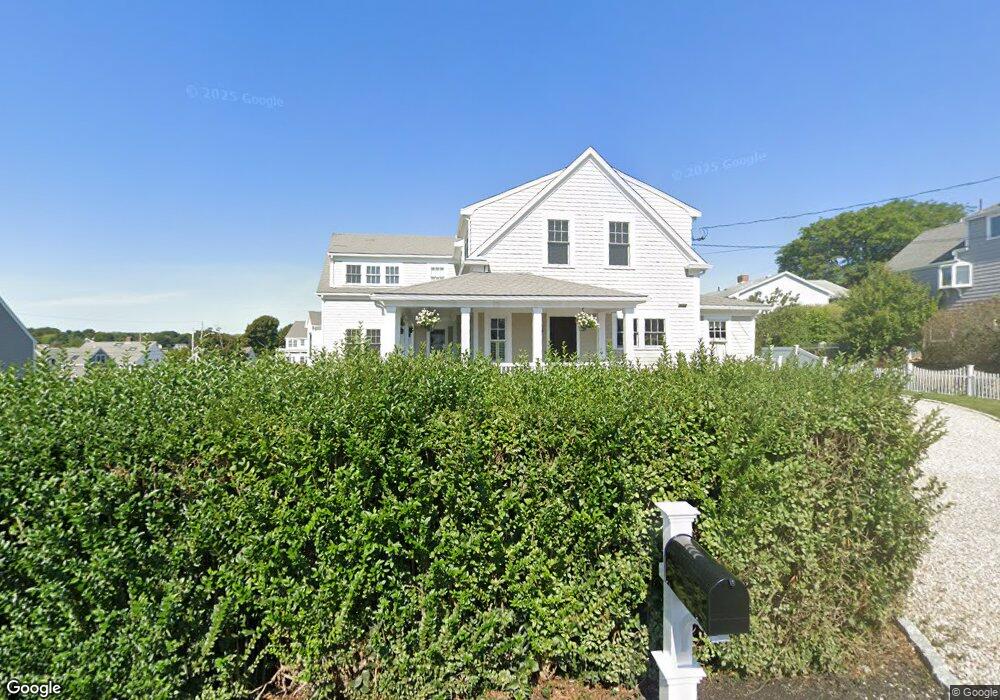
47 Peggotty Beach Rd Unit 47R Scituate, MA 02066
Estimated Value: $1,988,000 - $3,274,000
5
Beds
5
Baths
4,252
Sq Ft
$638/Sq Ft
Est. Value
About This Home
This home is located at 47 Peggotty Beach Rd Unit 47R, Scituate, MA 02066 and is currently estimated at $2,712,863, approximately $638 per square foot. 47 Peggotty Beach Rd Unit 47R is a home located in Plymouth County with nearby schools including Jenkins Elementary School, Lester J. Gates Middle School, and Scituate High School.
Ownership History
Date
Name
Owned For
Owner Type
Purchase Details
Closed on
Mar 30, 2016
Sold by
Norton Joseph P and Norton Anne S
Bought by
Norton Joseph P and Peters Kurt B
Current Estimated Value
Purchase Details
Closed on
Oct 26, 2015
Sold by
Norton Joseph P
Bought by
Norton Joseph P and Peters Kimberly A
Home Financials for this Owner
Home Financials are based on the most recent Mortgage that was taken out on this home.
Original Mortgage
$682,000
Interest Rate
3.9%
Mortgage Type
VA
Purchase Details
Closed on
Feb 25, 2010
Sold by
Peters Kurt B and Peters Kimberly A
Bought by
Peters Kurt B and Peters Kimberly A
Purchase Details
Closed on
Jun 29, 1994
Sold by
Serpa Doris and Porier Lorreta
Bought by
Peters Kurt B and Norton Kimberly A
Create a Home Valuation Report for This Property
The Home Valuation Report is an in-depth analysis detailing your home's value as well as a comparison with similar homes in the area
Home Values in the Area
Average Home Value in this Area
Purchase History
| Date | Buyer | Sale Price | Title Company |
|---|---|---|---|
| Norton Joseph P | -- | -- | |
| Norton Joseph P | -- | -- | |
| Norton Joseph P | -- | -- | |
| Norton Joseph P | -- | -- | |
| Peters Kurt B | -- | -- | |
| Peters Kurt B | $170,000 | -- |
Source: Public Records
Mortgage History
| Date | Status | Borrower | Loan Amount |
|---|---|---|---|
| Previous Owner | Norton Joseph P | $682,000 | |
| Previous Owner | Peters Kurt B | $500,000 | |
| Previous Owner | Peters Kurt B | $210,000 | |
| Previous Owner | Peters Kurt B | $88,600 |
Source: Public Records
Tax History Compared to Growth
Tax History
| Year | Tax Paid | Tax Assessment Tax Assessment Total Assessment is a certain percentage of the fair market value that is determined by local assessors to be the total taxable value of land and additions on the property. | Land | Improvement |
|---|---|---|---|---|
| 2025 | $24,179 | $2,420,300 | $1,175,600 | $1,244,700 |
| 2024 | $24,381 | $2,353,400 | $1,125,000 | $1,228,400 |
| 2023 | $23,550 | $2,115,900 | $1,022,700 | $1,093,200 |
| 2022 | $22,753 | $1,802,900 | $875,300 | $927,600 |
| 2021 | $22,160 | $1,662,400 | $833,700 | $828,700 |
| 2020 | $21,604 | $1,600,300 | $801,500 | $798,800 |
| 2019 | $21,271 | $1,548,100 | $785,800 | $762,300 |
| 2018 | $17,920 | $1,284,600 | $645,500 | $639,100 |
| 2017 | $17,166 | $1,218,300 | $601,700 | $616,600 |
| 2016 | $16,763 | $1,185,500 | $568,900 | $616,600 |
| 2015 | $14,384 | $1,098,000 | $481,400 | $616,600 |
Source: Public Records
Map
Nearby Homes
- 12 Meeting House Ln Unit 308
- 91 Front St Unit 106
- 23 Sunset Rd
- 50 First Parish Rd
- 59 Greenfield Ln
- 67 Greenfield Ln
- 76 A Brook St
- 76 A Brook St Unit 1
- 2 Collier Rd
- 32 Barker Rd Unit 3
- 37 Moorland Rd
- 74 Tilden Rd
- 12 Richfield Rd
- 105 Turner Rd
- 23 Oceanside Dr
- 29 Ladds Way Unit 29
- 23 Lois Ann Ct Unit 23
- 19 Ford Place Unit 3
- 19 Ford Place Unit 1
- 19 Ford Place Unit 4
- 36 Crescent Ave
- 43 Peggotty Beach Rd
- 45 Peggotty Beach Rd
- 28 Crescent Ave
- 28 Crescent Ave Unit 1
- 26 Crescent Ave
- 37 Peggotty Beach Rd
- 52 Peggotty Beach Rd
- 35 Crescent Ave
- 40 Crescent Ave
- 40 Peggotty Beach Rd
- 33 Crescent Ave
- 4 Peggotty Beach
- 35 Peggotty Beach Rd
- 24 Crescent Ave
- 45 Crescent Ave
- 27 Crescent Ave
- 56 Peggotty Beach Rd
- 38 Peggotty Beach Rd
- 6 Peggotty Beach