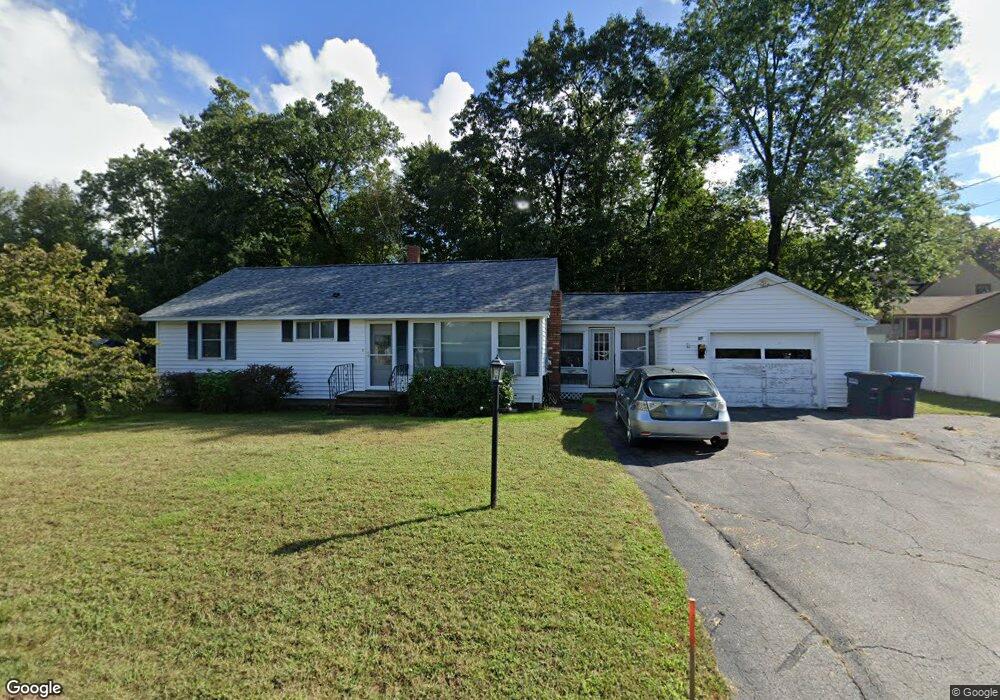
47 Ridge Rd Allenstown, NH 03275
Suncook NeighborhoodEstimated Value: $387,000 - $412,000
3
Beds
1
Bath
1,535
Sq Ft
$262/Sq Ft
Est. Value
About This Home
This home is located at 47 Ridge Rd, Allenstown, NH 03275 and is currently estimated at $401,716, approximately $261 per square foot. 47 Ridge Rd is a home located in Merrimack County with nearby schools including Allenstown Elementary School, Armand R. Dupont School, and Tender Years Child Care & Learning Center.
Ownership History
Date
Name
Owned For
Owner Type
Purchase Details
Closed on
Aug 19, 2005
Sold by
Chandler Michael
Bought by
Davis Johnathan M and Davis Cheryl A
Current Estimated Value
Home Financials for this Owner
Home Financials are based on the most recent Mortgage that was taken out on this home.
Original Mortgage
$160,000
Outstanding Balance
$32,591
Interest Rate
5.66%
Estimated Equity
$369,125
Purchase Details
Closed on
Oct 1, 2004
Sold by
Langford Simone I
Bought by
Chandler Michael
Home Financials for this Owner
Home Financials are based on the most recent Mortgage that was taken out on this home.
Original Mortgage
$155,920
Interest Rate
5.81%
Mortgage Type
Purchase Money Mortgage
Create a Home Valuation Report for This Property
The Home Valuation Report is an in-depth analysis detailing your home's value as well as a comparison with similar homes in the area
Home Values in the Area
Average Home Value in this Area
Purchase History
| Date | Buyer | Sale Price | Title Company |
|---|---|---|---|
| Davis Johnathan M | $200,000 | -- | |
| Davis Johnathan M | $200,000 | -- | |
| Chandler Michael | $194,900 | -- |
Source: Public Records
Mortgage History
| Date | Status | Borrower | Loan Amount |
|---|---|---|---|
| Open | Davis Johnathan M | $160,000 | |
| Closed | Chandler Michael | $160,000 | |
| Previous Owner | Chandler Michael | $155,920 |
Source: Public Records
Tax History Compared to Growth
Tax History
| Year | Tax Paid | Tax Assessment Tax Assessment Total Assessment is a certain percentage of the fair market value that is determined by local assessors to be the total taxable value of land and additions on the property. | Land | Improvement |
|---|---|---|---|---|
| 2024 | $8,241 | $324,200 | $145,200 | $179,000 |
| 2023 | $6,873 | $324,200 | $145,200 | $179,000 |
| 2022 | $6,322 | $324,200 | $145,200 | $179,000 |
| 2021 | $5,957 | $189,100 | $82,500 | $106,600 |
| 2020 | $5,541 | $189,100 | $82,500 | $106,600 |
| 2019 | $5,819 | $187,100 | $82,500 | $104,600 |
| 2018 | $5,641 | $187,100 | $82,500 | $104,600 |
| 2017 | $6,008 | $187,100 | $82,500 | $104,600 |
| 2016 | $5,316 | $157,000 | $60,000 | $97,000 |
| 2015 | $5,154 | $157,000 | $60,000 | $97,000 |
| 2014 | $5,300 | $156,900 | $60,000 | $96,900 |
| 2013 | $4,947 | $156,900 | $60,000 | $96,900 |
Source: Public Records
Map
Nearby Homes
- 422 Dawn Dr Unit 23
- 427 Dawn Dr Unit 15
- 15 Main St
- 4 Rodger Rd
- 19 Sullivan Dr
- 1 1/2 Bartlett St
- 7 Ferry St
- 111 Glass St
- 100 Main St Unit M10
- 100 Main St Unit 204
- 12-14 Church St Unit 12,14
- 10 Lane Dr
- 2 Cheryl Dr
- 15 Sullivan Dr
- 1821 Hooksett Rd
- 307 Dearborn Rd
- 233 Pembroke St
- 259 Pembroke St
- 14 Manor Dr Unit D
- 12 Manor Dr Unit B