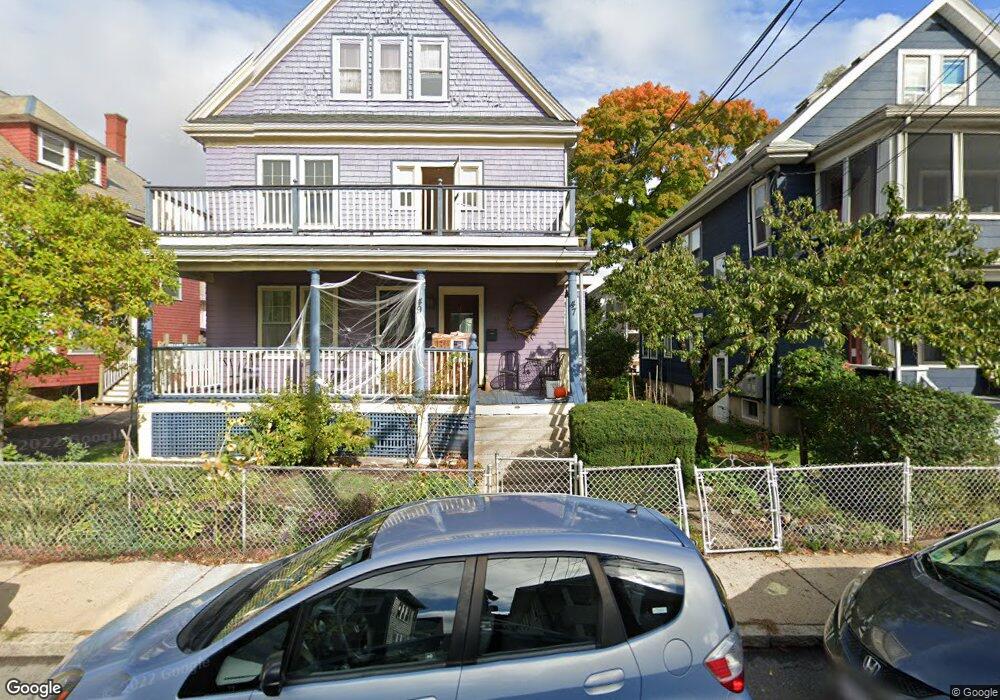
47 Royal St Unit 49 Allston, MA 02134
Allston NeighborhoodEstimated Value: $1,295,000 - $1,405,485
4
Beds
3
Baths
3,334
Sq Ft
$401/Sq Ft
Est. Value
About This Home
This home is located at 47 Royal St Unit 49, Allston, MA 02134 and is currently estimated at $1,338,121, approximately $401 per square foot. 47 Royal St Unit 49 is a home located in Suffolk County with nearby schools including Match Charter Public School, German International School Boston, and St Herman Of Alaska Christian School.
Ownership History
Date
Name
Owned For
Owner Type
Purchase Details
Closed on
Jan 15, 2021
Sold by
Rogers Richard
Bought by
Rogers Richard and Stock Victoria K
Current Estimated Value
Home Financials for this Owner
Home Financials are based on the most recent Mortgage that was taken out on this home.
Original Mortgage
$1,080,000
Outstanding Balance
$949,829
Interest Rate
2.67%
Mortgage Type
New Conventional
Estimated Equity
$388,292
Purchase Details
Closed on
Jul 1, 2003
Sold by
Mcissoc Donald and Mcissac Ann M
Bought by
Rogers Richard
Home Financials for this Owner
Home Financials are based on the most recent Mortgage that was taken out on this home.
Original Mortgage
$74,000
Interest Rate
5.69%
Purchase Details
Closed on
Apr 2, 1990
Sold by
Mcisaac Mildred T
Bought by
Mcisaac Donald
Create a Home Valuation Report for This Property
The Home Valuation Report is an in-depth analysis detailing your home's value as well as a comparison with similar homes in the area
Home Values in the Area
Average Home Value in this Area
Purchase History
We collect this data history from publicly available records. To have your information removed, we recommend requesting removal directly through your county’s website.
| Date | Buyer | Sale Price | Title Company |
|---|---|---|---|
| Rogers Richard | -- | None Available | |
| Rogers Richard | $589,500 | -- | |
| Mcisaac Donald | $277,333 | -- | |
| Mcisaac Donald G | $277,333 | -- |
Source: Public Records
Mortgage History
We collect this data history from publicly available records. To have your information removed, we recommend requesting removal directly through your county’s website.
| Date | Status | Borrower | Loan Amount |
|---|---|---|---|
| Open | Rogers Richard | $1,080,000 | |
| Previous Owner | Mcisaac Donald G | $87,524 | |
| Previous Owner | Mcisaac Donald G | $74,000 | |
| Previous Owner | Mcisaac Donald G | $501,075 |
Source: Public Records
Tax History
| Year | Tax Paid | Tax Assessment Tax Assessment Total Assessment is a certain percentage of the fair market value that is determined by local assessors to be the total taxable value of land and additions on the property. | Land | Improvement |
|---|---|---|---|---|
| 2025 | $15,240 | $1,316,100 | $446,800 | $869,300 |
| 2024 | $12,971 | $1,190,000 | $323,100 | $866,900 |
| 2023 | $12,288 | $1,144,100 | $310,600 | $833,500 |
| 2022 | $11,855 | $1,089,600 | $295,800 | $793,800 |
| 2021 | $11,398 | $1,068,200 | $290,000 | $778,200 |
| 2020 | $10,582 | $1,002,100 | $278,400 | $723,700 |
| 2019 | $9,874 | $936,800 | $199,600 | $737,200 |
| 2018 | $9,350 | $892,200 | $199,600 | $692,600 |
| 2017 | $8,748 | $826,100 | $199,600 | $626,500 |
| 2016 | $7,902 | $718,400 | $199,600 | $518,800 |
| 2015 | $7,466 | $616,500 | $187,000 | $429,500 |
| 2014 | $6,744 | $536,100 | $187,000 | $349,100 |
Source: Public Records
Map
Nearby Homes
- 63 Coolidge Rd
- 19 Royal St Unit 6
- 10 Royal St
- 251 Cambridge St
- 10 Alcott St
- 245 Cambridge St
- 2 Holmes St
- 195 Cambridge St Unit 3
- 4 Franklin St Unit 202
- 4 Franklin St Unit 401
- 15 Raymond St Unit A
- 35 Adamson St
- 14-16 Aldie St
- 231 Everett St Unit 1
- 287 Everett St Unit 1
- 45 Ashford St Unit 1
- 97 Chester St Unit 8
- 20 Penniman Rd Unit P3
- 30 Penniman Rd Unit 702
- 30 Penniman Rd Unit 506
- 32 Arden St Unit 2
- 32 Arden St
- 32 Arden St
- 32 Arden St Unit 1
- 32 Coolidge Rd Unit 2
- 30 Coolidge Rd
- 34 Coolidge Rd Unit 36
- 34 Coolidge Rd Unit C
- 34 Coolidge Rd Unit B
- 34 Coolidge Rd Unit E
- 34 Coolidge Rd Unit D
- 28 Arden St
- 34 Coolidge Road Boston Ma 02134
- 27 Holman St Unit 29
- 27 Holman St Unit Holman St.
- 27 Holman St Unit 1
- 27 Holman St
- 29 Holman St Unit 1
- 26 Arden St
- 23 Holman St Unit 25
Your Personal Tour Guide
Ask me questions while you tour the home.