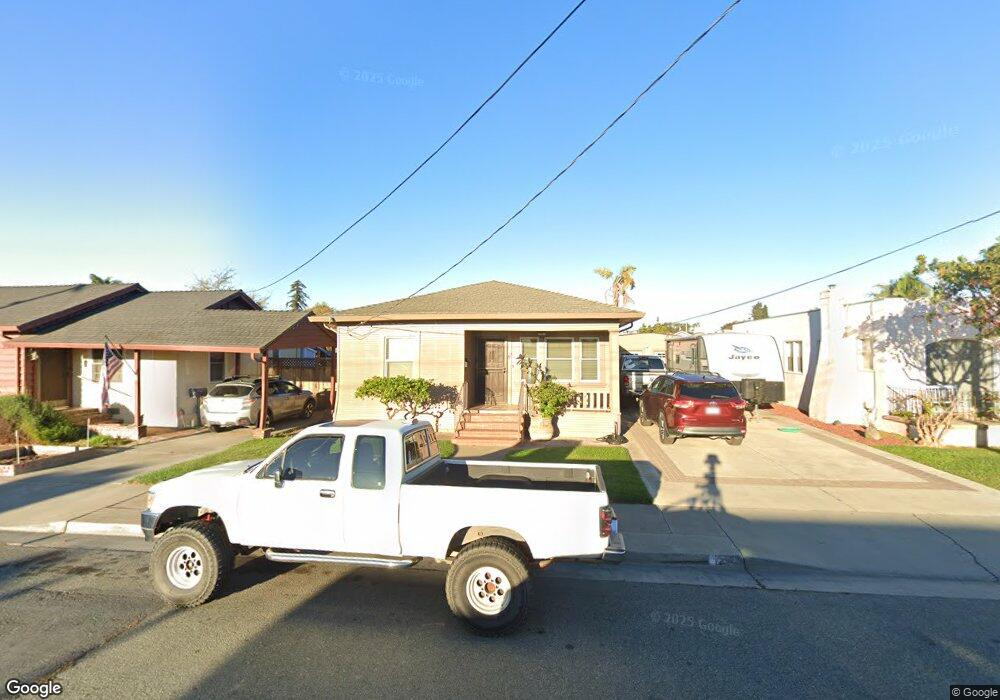
47 Tharp Ave Watsonville, CA 95076
Estimated Value: $766,065 - $848,000
2
Beds
1
Bath
1,689
Sq Ft
$470/Sq Ft
Est. Value
About This Home
This home is located at 47 Tharp Ave, Watsonville, CA 95076 and is currently estimated at $794,266, approximately $470 per square foot. 47 Tharp Ave is a home located in Santa Cruz County with nearby schools including Mintie White Elementary School, E.A. Hall Middle School, and Watsonville High School.
Ownership History
Date
Name
Owned For
Owner Type
Purchase Details
Closed on
Jan 26, 2023
Sold by
Gomez Tomas P and Gomez Evangelina O
Bought by
Tomas And Evangelina Gomez Revocable Living T
Current Estimated Value
Purchase Details
Closed on
Nov 29, 1993
Sold by
James Everett M and Estate Of June Elaine Quinto
Bought by
Gomez Thomas P and Gomez Evangelina O
Home Financials for this Owner
Home Financials are based on the most recent Mortgage that was taken out on this home.
Original Mortgage
$117,000
Interest Rate
6.74%
Create a Home Valuation Report for This Property
The Home Valuation Report is an in-depth analysis detailing your home's value as well as a comparison with similar homes in the area
Home Values in the Area
Average Home Value in this Area
Purchase History
| Date | Buyer | Sale Price | Title Company |
|---|---|---|---|
| Tomas And Evangelina Gomez Revocable Living T | -- | -- | |
| Gomez Thomas P | $156,000 | Old Republic Title Company |
Source: Public Records
Mortgage History
| Date | Status | Borrower | Loan Amount |
|---|---|---|---|
| Previous Owner | Gomez Thomas P | $117,000 |
Source: Public Records
Tax History
| Year | Tax Paid | Tax Assessment Tax Assessment Total Assessment is a certain percentage of the fair market value that is determined by local assessors to be the total taxable value of land and additions on the property. | Land | Improvement |
|---|---|---|---|---|
| 2025 | $3,920 | $341,328 | $152,975 | $188,353 |
| 2023 | $3,859 | $328,074 | $147,035 | $181,039 |
| 2022 | $3,789 | $321,641 | $144,152 | $177,489 |
| 2021 | $3,724 | $315,334 | $141,325 | $174,009 |
| 2020 | $3,671 | $312,101 | $139,876 | $172,225 |
| 2019 | $3,604 | $305,982 | $137,134 | $168,848 |
| 2018 | $3,512 | $299,982 | $134,445 | $165,537 |
| 2017 | $2,883 | $243,056 | $131,808 | $111,248 |
| 2016 | $2,729 | $231,624 | $129,224 | $102,400 |
| 2015 | $2,718 | $228,145 | $127,283 | $100,862 |
| 2014 | $2,658 | $223,676 | $124,790 | $98,886 |
Source: Public Records
Map
Nearby Homes
Your Personal Tour Guide
Ask me questions while you tour the home.