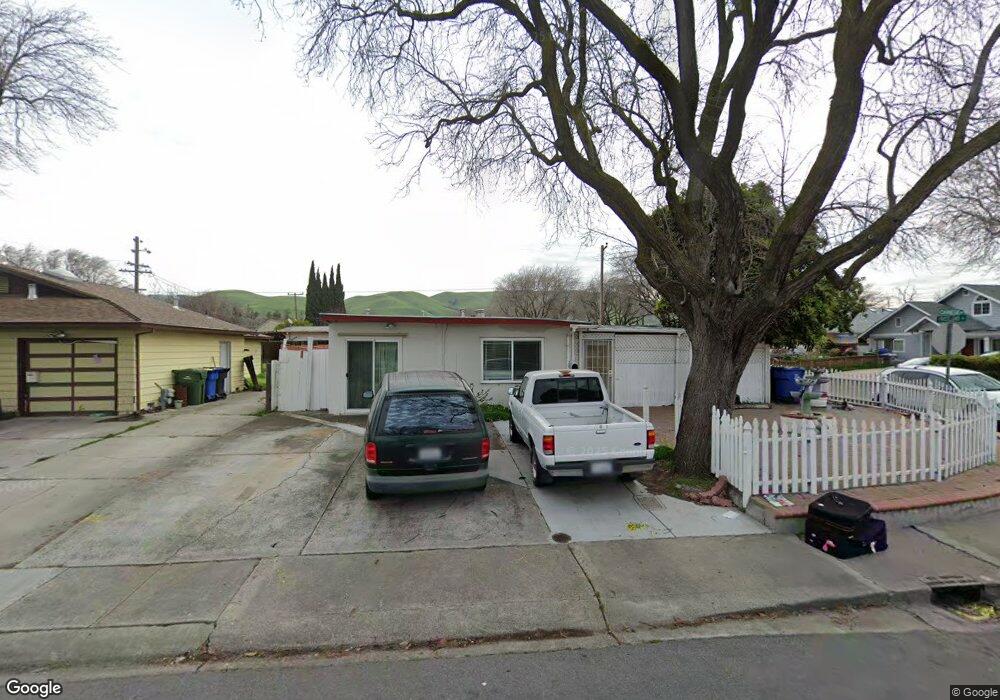
470 Carnegie Dr Milpitas, CA 95035
Estimated Value: $1,243,000 - $1,600,603
6
Beds
5
Baths
1,154
Sq Ft
$1,275/Sq Ft
Est. Value
About This Home
This home is located at 470 Carnegie Dr, Milpitas, CA 95035 and is currently estimated at $1,471,151, approximately $1,274 per square foot. 470 Carnegie Dr is a home located in Santa Clara County with nearby schools including Robert Randall Elementary School, Alexander Rose Elementary School, and Rancho Milpitas Middle School.
Ownership History
Date
Name
Owned For
Owner Type
Purchase Details
Closed on
Apr 19, 2016
Sold by
Kang Harcharan
Bought by
The Harcharan Kang Revocable Living Trus and Kang Harcharan
Current Estimated Value
Create a Home Valuation Report for This Property
The Home Valuation Report is an in-depth analysis detailing your home's value as well as a comparison with similar homes in the area
Home Values in the Area
Average Home Value in this Area
Purchase History
| Date | Buyer | Sale Price | Title Company |
|---|---|---|---|
| The Harcharan Kang Revocable Living Trus | -- | None Available |
Source: Public Records
Tax History
| Year | Tax Paid | Tax Assessment Tax Assessment Total Assessment is a certain percentage of the fair market value that is determined by local assessors to be the total taxable value of land and additions on the property. | Land | Improvement |
|---|---|---|---|---|
| 2025 | $3,682 | $319,070 | $93,568 | $225,502 |
| 2024 | $3,682 | $312,815 | $91,734 | $221,081 |
| 2023 | $3,668 | $306,683 | $89,936 | $216,747 |
| 2022 | $3,654 | $300,671 | $88,173 | $212,498 |
| 2021 | $3,599 | $294,777 | $86,445 | $208,332 |
| 2020 | $3,535 | $291,755 | $85,559 | $206,196 |
| 2019 | $3,495 | $286,035 | $83,882 | $202,153 |
| 2018 | $3,321 | $280,428 | $82,238 | $198,190 |
| 2017 | $3,276 | $274,930 | $80,626 | $194,304 |
| 2016 | $3,137 | $269,541 | $79,046 | $190,495 |
| 2015 | $3,104 | $265,493 | $77,859 | $187,634 |
| 2014 | $3,006 | $260,293 | $76,334 | $183,959 |
Source: Public Records
Map
Nearby Homes
- 397 S Park Victoria Dr
- 496 Dempsey Rd Unit 199
- 484 Dempsey Rd Unit 186
- 1260 Glacier Dr
- 136 Lawton Dr
- 1490 Mount Diablo Ave
- 808 Cameron Cir
- 25 Terfidia Ln
- 1759 Tahoe Dr
- 2202 Yosemite Dr
- 2235 Skyline Dr
- 258 Lynn Ave
- 1430 Cuciz Ln
- 1995 Old Calaveras Rd
- 2144 Ashwood Ln
- 861 Garden St
- 672 Amalfi Loop
- 2085 Ashwood Ln
- 3647 Madrid Dr
- 2074 Ashwood Ln
- 460 Carnegie Dr
- 1423 Freeland Dr
- 450 Carnegie Dr
- 1400 Freeland Dr
- 1433 Freeland Dr
- 1410 Freeland Dr
- 1420 Freeland Dr
- 440 Carnegie Dr
- 475 Carnegie Dr
- 463 Carnegie Dr
- 483 Carnegie Dr
- 1441 Freeland Dr
- 455 Carnegie Dr
- 1432 Freeland Dr
- 431 Mars Ct
- 491 Carnegie Dr
- 430 Mars Ct
- 447 Carnegie Dr
- 430 Carnegie Dr
- 1440 Freeland Dr
Your Personal Tour Guide
Ask me questions while you tour the home.