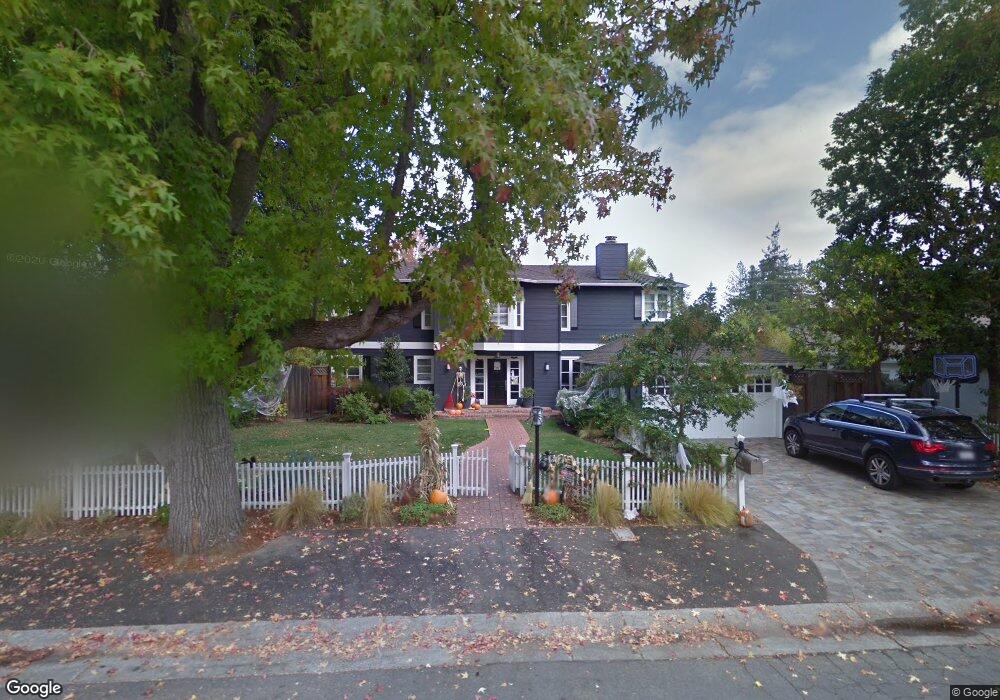
470 Cotton St Menlo Park, CA 94025
Central Menlo Park NeighborhoodEstimated Value: $4,753,000 - $5,660,000
4
Beds
3
Baths
2,322
Sq Ft
$2,199/Sq Ft
Est. Value
About This Home
This home is located at 470 Cotton St, Menlo Park, CA 94025 and is currently estimated at $5,104,931, approximately $2,198 per square foot. 470 Cotton St is a home located in San Mateo County with nearby schools including Oak Knoll Elementary School, Hillview Middle School, and Menlo-Atherton High School.
Ownership History
Date
Name
Owned For
Owner Type
Purchase Details
Closed on
Jun 19, 2015
Sold by
Mrva Gregory E and Mrva Vickie
Bought by
Mrva Family Trust and Mrva Vickie Bond
Current Estimated Value
Purchase Details
Closed on
Aug 19, 2005
Sold by
Hughes David and Hughes Jane
Bought by
Mrva Gregory E and Mrva Vickie
Home Financials for this Owner
Home Financials are based on the most recent Mortgage that was taken out on this home.
Original Mortgage
$210,000
Outstanding Balance
$157,292
Interest Rate
5.56%
Mortgage Type
Credit Line Revolving
Estimated Equity
$4,947,639
Purchase Details
Closed on
Sep 12, 2002
Sold by
Hughes David and Hughes Jane
Bought by
Hughes David and Hughes Jane
Home Financials for this Owner
Home Financials are based on the most recent Mortgage that was taken out on this home.
Original Mortgage
$621,000
Interest Rate
6.24%
Purchase Details
Closed on
Mar 10, 2000
Sold by
David Hughes
Bought by
Hughes David and Hughes Jane
Create a Home Valuation Report for This Property
The Home Valuation Report is an in-depth analysis detailing your home's value as well as a comparison with similar homes in the area
Home Values in the Area
Average Home Value in this Area
Purchase History
| Date | Buyer | Sale Price | Title Company |
|---|---|---|---|
| Mrva Family Trust | -- | None Available | |
| Mrva Gregory E | $2,100,000 | First American Title Co | |
| Hughes David | -- | Alliance Title | |
| Hughes David | -- | -- |
Source: Public Records
Mortgage History
| Date | Status | Borrower | Loan Amount |
|---|---|---|---|
| Open | Mrva Gregory E | $210,000 | |
| Open | Mrva Gregory E | $1,470,000 | |
| Previous Owner | Hughes David | $621,000 |
Source: Public Records
Tax History Compared to Growth
Tax History
| Year | Tax Paid | Tax Assessment Tax Assessment Total Assessment is a certain percentage of the fair market value that is determined by local assessors to be the total taxable value of land and additions on the property. | Land | Improvement |
|---|---|---|---|---|
| 2025 | $34,303 | $2,933,551 | $1,434,907 | $1,498,644 |
| 2023 | $34,303 | $2,819,641 | $1,379,189 | $1,440,452 |
| 2022 | $32,749 | $2,764,356 | $1,352,147 | $1,412,209 |
| 2021 | $32,080 | $2,710,155 | $1,325,635 | $1,384,520 |
| 2020 | $31,905 | $2,682,368 | $1,312,043 | $1,370,325 |
| 2019 | $31,469 | $2,629,774 | $1,286,317 | $1,343,457 |
| 2018 | $30,692 | $2,578,212 | $1,261,096 | $1,317,116 |
| 2017 | $30,232 | $2,527,660 | $1,236,369 | $1,291,291 |
| 2016 | $29,449 | $2,478,100 | $1,212,127 | $1,265,973 |
| 2015 | $29,181 | $2,440,878 | $1,193,920 | $1,246,958 |
| 2014 | -- | $2,393,066 | $1,170,533 | $1,222,533 |
Source: Public Records
Map
Nearby Homes
- 460 Olive St
- 455 San Mateo Dr
- 1715 Bay Laurel Dr
- 1001 Olive St
- 705 Evergreen St
- 1100 Hobart St
- 1278 Santa Cruz Ave
- 308 Yale Rd
- 905 Fremont Place
- 1224 Whitaker Way
- 841 Partridge Ave
- 1840 Santa Cruz Ave
- 8 Nancy Way
- 2030 Sand Hill Rd
- 1357 Johnson St
- 83 Camino Por Los Arboles
- 660 Roble Ave
- 5 Artisan Way
- 93 Camino Por Los Arboles
- 115 El Camino Real Unit 202
- 480 Cotton St
- 460 Cotton St
- 435 Hermosa Way
- 415 Hermosa Way
- 445 Hermosa Way
- 1399 Middle Ave
- 450 Cotton St
- 475 Cotton St
- 465 Cotton St
- 485 Cotton St
- 385 Hermosa Way
- 455 Hermosa Way
- 495 Cotton St
- 455 Cotton St
- 440 Cotton St
- 365 Hermosa Way
- 8 Garland Place
- 430 Hermosa Way
- 10 Garland Place
- 1 Hermosa Place