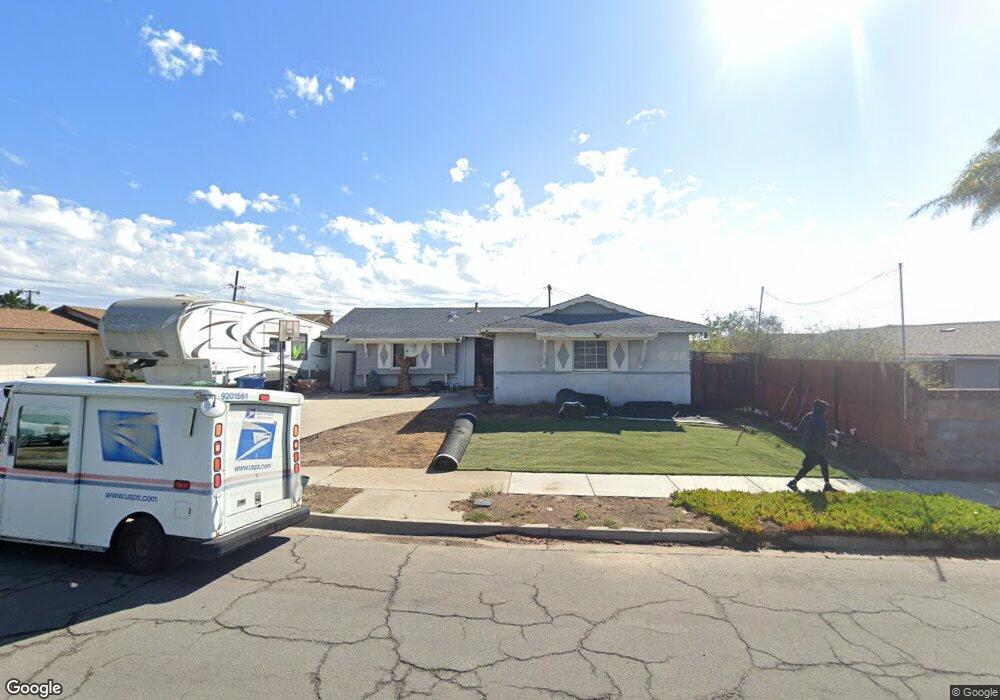
470 Terra Way Lompoc, CA 93436
Estimated Value: $521,775 - $567,000
3
Beds
2
Baths
1,242
Sq Ft
$439/Sq Ft
Est. Value
About This Home
This home is located at 470 Terra Way, Lompoc, CA 93436 and is currently estimated at $545,194, approximately $438 per square foot. 470 Terra Way is a home located in Santa Barbara County with nearby schools including Buena Vista Elementary School, Cabrillo High School, and Olive Grove Charter - Lompoc.
Ownership History
Date
Name
Owned For
Owner Type
Purchase Details
Closed on
Jul 27, 2017
Sold by
Martin Michael L and Joseph Donald
Bought by
Shadowens Chrystal Rose
Current Estimated Value
Home Financials for this Owner
Home Financials are based on the most recent Mortgage that was taken out on this home.
Original Mortgage
$9,975
Outstanding Balance
$8,334
Interest Rate
3.92%
Mortgage Type
FHA
Estimated Equity
$536,860
Purchase Details
Closed on
Jun 10, 2005
Sold by
Frisby Joseph Donald and Frisby Bernice A
Bought by
Frisby Joseph Donald and Frisby Bernice A
Create a Home Valuation Report for This Property
The Home Valuation Report is an in-depth analysis detailing your home's value as well as a comparison with similar homes in the area
Home Values in the Area
Average Home Value in this Area
Purchase History
| Date | Buyer | Sale Price | Title Company |
|---|---|---|---|
| Shadowens Chrystal Rose | $285,000 | Fidelity National Title Co | |
| Frisby Joseph Donald | -- | -- |
Source: Public Records
Mortgage History
| Date | Status | Borrower | Loan Amount |
|---|---|---|---|
| Open | Shadowens Chrystal Rose | $9,975 | |
| Open | Shadowens Chrystal Rose | $279,837 |
Source: Public Records
Tax History
| Year | Tax Paid | Tax Assessment Tax Assessment Total Assessment is a certain percentage of the fair market value that is determined by local assessors to be the total taxable value of land and additions on the property. | Land | Improvement |
|---|---|---|---|---|
| 2025 | $3,864 | $324,277 | $136,537 | $187,740 |
| 2023 | $3,864 | $311,686 | $131,236 | $180,450 |
| 2022 | $3,806 | $305,575 | $128,663 | $176,912 |
| 2021 | $3,846 | $299,585 | $126,141 | $173,444 |
| 2020 | $3,808 | $296,514 | $124,848 | $171,666 |
| 2019 | $3,753 | $290,700 | $122,400 | $168,300 |
| 2018 | $3,701 | $285,000 | $120,000 | $165,000 |
| 2017 | $764 | $48,540 | $10,528 | $38,012 |
| 2016 | $483 | $47,589 | $10,322 | $37,267 |
| 2014 | $470 | $45,957 | $9,968 | $35,989 |
Source: Public Records
Map
Nearby Homes
- 3843 Cassini Cir Unit 3
- 3916 Mesa Circle Dr Unit A
- 3922 Mesa Circle Dr
- 3939 Mesa Circle Dr
- 3725 Jupiter Ave
- 728 Pluto Ave
- 232 Vega Ave
- 250 Saint Andrews Way
- 384 Falcon Crest Dr
- 113 Gemini Ave
- 4173 Oakwood Ct
- 372 Falcon Crest Dr
- 6 Stanford Cir
- 18 Galaxy Way
- 73 Stanford Cir
- 649 Burning Tree Way
- 372 Oak Hill Dr
- 0 Oak Hill Dr Unit 24-783
- 972 Pellham Dr
- 832 Onstott Rd
Your Personal Tour Guide
Ask me questions while you tour the home.