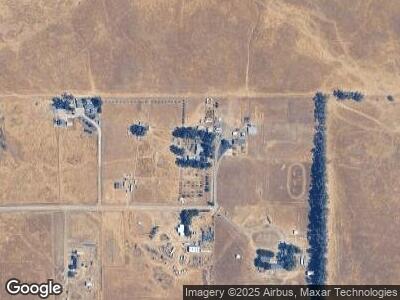
4700 Alder Ln Sheridan, CA 95681
Estimated Value: $402,000 - $791,000
3
Beds
2
Baths
1,050
Sq Ft
$537/Sq Ft
Est. Value
About This Home
This home is located at 4700 Alder Ln, Sheridan, CA 95681 and is currently estimated at $563,835, approximately $536 per square foot. 4700 Alder Ln is a home located in Placer County with nearby schools including Glen Edwards Middle and Lincoln High.
Ownership History
Date
Name
Owned For
Owner Type
Purchase Details
Closed on
Jul 24, 2013
Sold by
Reese Sharyl Ann
Bought by
Reese Sharyl Ann
Current Estimated Value
Home Financials for this Owner
Home Financials are based on the most recent Mortgage that was taken out on this home.
Original Mortgage
$101,000
Interest Rate
3.98%
Mortgage Type
New Conventional
Purchase Details
Closed on
Nov 10, 2011
Sold by
Reese David Wayne and Reese Sharyl A
Bought by
Reese Sharyl A
Purchase Details
Closed on
Jun 21, 2011
Sold by
Reese Sharyl A
Bought by
Reese Sharyl Ann
Purchase Details
Closed on
Jul 16, 1998
Sold by
Thompson Jerry W and Thompson Judy M
Bought by
Reese David W and Reese Sharyl A
Home Financials for this Owner
Home Financials are based on the most recent Mortgage that was taken out on this home.
Original Mortgage
$145,000
Interest Rate
6.9%
Mortgage Type
Purchase Money Mortgage
Create a Home Valuation Report for This Property
The Home Valuation Report is an in-depth analysis detailing your home's value as well as a comparison with similar homes in the area
Home Values in the Area
Average Home Value in this Area
Purchase History
| Date | Buyer | Sale Price | Title Company |
|---|---|---|---|
| Reese Sharyl Ann | -- | Stewart Title Of Placer | |
| Reese Sharyl Ann | -- | Stewart Title Of Placer | |
| Reese Sharyl Ann | -- | None Available | |
| Reese David W | $170,000 | North American Title Guarant |
Source: Public Records
Mortgage History
| Date | Status | Borrower | Loan Amount |
|---|---|---|---|
| Open | Reese Sharyl Ann | $89,800 | |
| Closed | Reese Sharyl Ann | $101,000 | |
| Closed | Reese David W | $20,000 | |
| Closed | Reese David W | $145,000 |
Source: Public Records
Tax History Compared to Growth
Tax History
| Year | Tax Paid | Tax Assessment Tax Assessment Total Assessment is a certain percentage of the fair market value that is determined by local assessors to be the total taxable value of land and additions on the property. | Land | Improvement |
|---|---|---|---|---|
| 2023 | $2,718 | $256,143 | $150,675 | $105,468 |
| 2022 | $2,642 | $251,121 | $147,721 | $103,400 |
| 2021 | $2,590 | $246,198 | $144,825 | $101,373 |
| 2020 | $2,576 | $243,674 | $143,340 | $100,334 |
| 2019 | $2,509 | $238,897 | $140,530 | $98,367 |
| 2018 | $2,447 | $234,214 | $137,775 | $96,439 |
| 2017 | $2,369 | $229,623 | $135,074 | $94,549 |
| 2016 | $2,313 | $225,122 | $132,426 | $92,696 |
| 2015 | $2,262 | $221,741 | $130,437 | $91,304 |
| 2014 | $2,204 | $217,398 | $127,882 | $89,516 |
Source: Public Records
Map
Nearby Homes