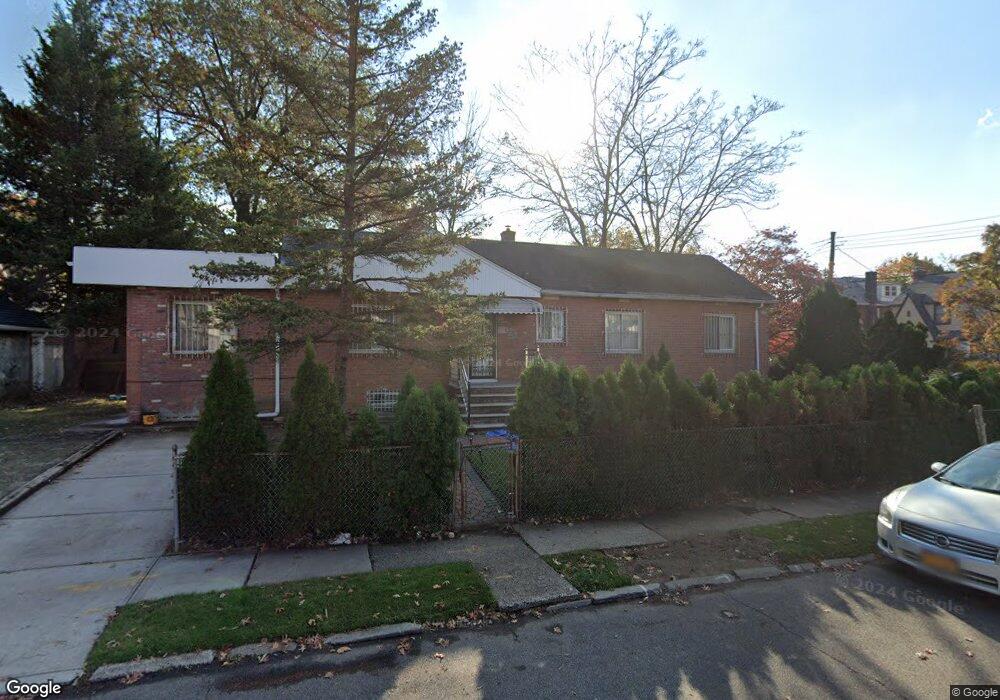
4701 158th St Flushing, NY 11358
East Flushing NeighborhoodEstimated Value: $866,000 - $1,153,000
Studio
--
Bath
1,040
Sq Ft
$961/Sq Ft
Est. Value
About This Home
This home is located at 4701 158th St, Flushing, NY 11358 and is currently estimated at $999,062, approximately $960 per square foot. 4701 158th St is a home located in Queens County with nearby schools including P.S. 107 Thomas A Dooley, Rachel Carson I.S. 237Q, and Francis Lewis High School.
Ownership History
Date
Name
Owned For
Owner Type
Purchase Details
Closed on
Feb 28, 2007
Sold by
Bhatti Shahzad A and Chaudry Farhat
Bought by
Bhatti Shahzad A and Chaudry Talat
Current Estimated Value
Home Financials for this Owner
Home Financials are based on the most recent Mortgage that was taken out on this home.
Original Mortgage
$310,000
Outstanding Balance
$187,206
Interest Rate
6.4%
Mortgage Type
Purchase Money Mortgage
Estimated Equity
$811,856
Purchase Details
Closed on
Dec 28, 1994
Sold by
Dinmohammed Chaudry
Bought by
Dinmohammed Chaudry and Bhatti Shahzad A
Purchase Details
Closed on
Nov 9, 1993
Sold by
Morales Javier E
Bought by
Mohammed Chaudry Din
Home Financials for this Owner
Home Financials are based on the most recent Mortgage that was taken out on this home.
Original Mortgage
$142,000
Interest Rate
6.77%
Create a Home Valuation Report for This Property
The Home Valuation Report is an in-depth analysis detailing your home's value as well as a comparison with similar homes in the area
Home Values in the Area
Average Home Value in this Area
Purchase History
| Date | Buyer | Sale Price | Title Company |
|---|---|---|---|
| Bhatti Shahzad A | $250,000 | -- | |
| Bhatti Shahzad A | $250,000 | -- | |
| Dinmohammed Chaudry | -- | First American Title Ins Co | |
| Dinmohammed Chaudry | -- | First American Title Ins Co | |
| Mohammed Chaudry Din | -- | -- | |
| Mohammed Chaudry Din | -- | -- |
Source: Public Records
Mortgage History
| Date | Status | Borrower | Loan Amount |
|---|---|---|---|
| Open | Bhatti Shahzad A | $310,000 | |
| Closed | Bhatti Shahzad A | $310,000 | |
| Previous Owner | Mohammed Chaudry Din | $142,000 |
Source: Public Records
Tax History
| Year | Tax Paid | Tax Assessment Tax Assessment Total Assessment is a certain percentage of the fair market value that is determined by local assessors to be the total taxable value of land and additions on the property. | Land | Improvement |
|---|---|---|---|---|
| 2025 | $8,196 | $43,255 | $13,882 | $29,373 |
| 2024 | $8,196 | $40,807 | $12,299 | $28,508 |
| 2023 | $8,196 | $40,807 | $13,266 | $27,541 |
| 2022 | $7,749 | $55,140 | $18,120 | $37,020 |
| 2021 | $8,041 | $50,040 | $18,120 | $31,920 |
| 2020 | $7,630 | $53,700 | $18,120 | $35,580 |
| 2019 | $7,114 | $52,020 | $18,120 | $33,900 |
| 2018 | $6,932 | $34,006 | $11,737 | $22,269 |
| 2017 | $6,594 | $32,347 | $12,241 | $20,106 |
| 2016 | $6,365 | $32,347 | $12,241 | $20,106 |
| 2015 | $3,644 | $30,038 | $14,093 | $15,945 |
| 2014 | $3,644 | $28,339 | $15,955 | $12,384 |
Source: Public Records
Map
Nearby Homes
- 157-18 Laburnum Ave
- 47-09 156th St
- 157-51 Rose Ave
- 148-29 Laburnum Ave
- 46-05 158th St
- 46-12 161st St Unit 1D
- 46-12 161st St Unit 2C
- 148-24 Kalmia Ave
- 47-21 162nd St
- 148-11 Kalmia Ave
- 146-18 Laburnum Ave
- 146-23 Laburnum Ave
- 45-57 160th St
- 45-19 158th St
- 52-06 Bowne St
- 45-74 164th St
- 14214 Quince Ave
- 52-05 Robinson St
- 47-23 164th St
- 149-27 45th Ave
- 4705 158th St
- 4709 158th St
- 47-21 158th St
- 15816 Laburnum Ave
- 15803 Laburnum Ave
- 4704 159th St
- 4713 158th St
- 4713 158th St
- 4710 159th St
- 47-29 158th St
- 158-11 Laburnum Ave
- 4665 158th St
- 46-65 158th St
- 15811 Laburnum Ave
- 15815 Laburnum Ave
- 4717 158th St
- 4714 159th St
- 15718 Laburnum Ave
- 4717 158th St
- 15815 Laburnum Ave
Your Personal Tour Guide
Ask me questions while you tour the home.