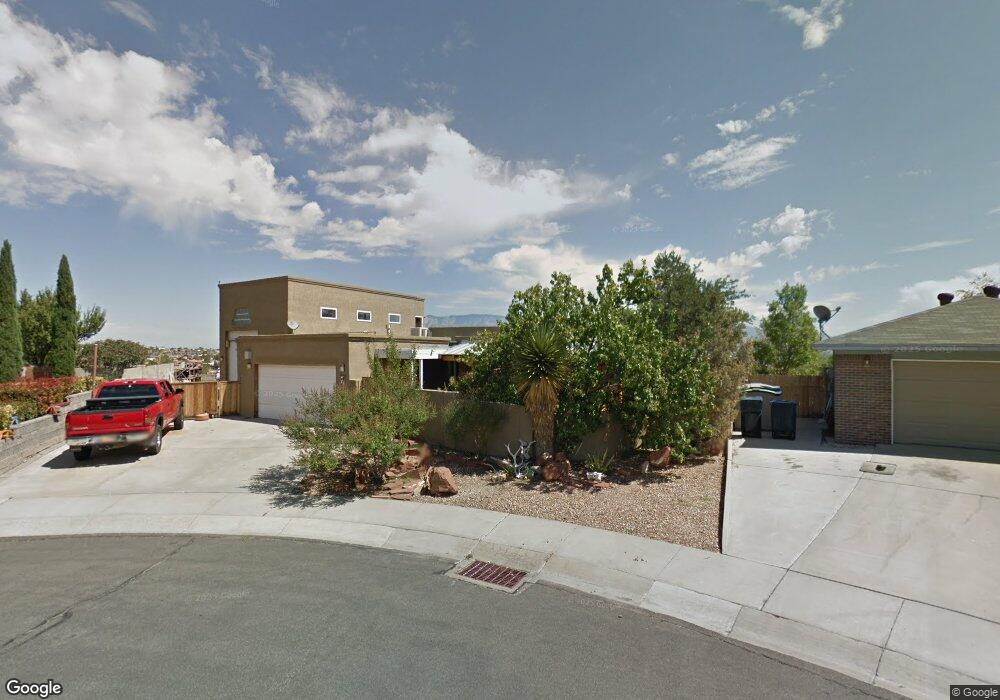
4701 Lewisburg Ct NW Albuquerque, NM 87120
Taylor Ranch NeighborhoodEstimated Value: $328,000 - $405,337
3
Beds
2
Baths
1,834
Sq Ft
$206/Sq Ft
Est. Value
About This Home
This home is located at 4701 Lewisburg Ct NW, Albuquerque, NM 87120 and is currently estimated at $377,334, approximately $205 per square foot. 4701 Lewisburg Ct NW is a home located in Bernalillo County with nearby schools including Chamiza Elementary School, L.B. Johnson Middle School, and Volcano Vista High School.
Ownership History
Date
Name
Owned For
Owner Type
Purchase Details
Closed on
Feb 5, 2021
Sold by
Moreno Ellecer Rodriguez and De Armas Yeney
Bought by
Dearmas Yeney C Taboada
Current Estimated Value
Purchase Details
Closed on
Sep 15, 2020
Sold by
Moreno Eliecer Rodriguez and De Armas Yeney
Bought by
Dearmas Yeney C Taboada
Purchase Details
Closed on
Jan 30, 2018
Bought by
Madrid Margaret
Home Financials for this Owner
Home Financials are based on the most recent Mortgage that was taken out on this home.
Original Mortgage
$216,422
Interest Rate
4.15%
Purchase Details
Closed on
Apr 16, 2004
Sold by
Marlow Kicha and Marlow Je Won
Bought by
Davis James Michael
Create a Home Valuation Report for This Property
The Home Valuation Report is an in-depth analysis detailing your home's value as well as a comparison with similar homes in the area
Home Values in the Area
Average Home Value in this Area
Purchase History
| Date | Buyer | Sale Price | Title Company |
|---|---|---|---|
| Dearmas Yeney C Taboada | -- | First American Title Ins Co | |
| Dearmas Yeney C Taboada | -- | First American Title Ins Co | |
| Moreno Eliecer Rodriguez | -- | First American Title Ins Co | |
| Madrid Margaret | -- | -- | |
| Davis James Michael | -- | Rio Grande Title Company Inc |
Source: Public Records
Mortgage History
| Date | Status | Borrower | Loan Amount |
|---|---|---|---|
| Previous Owner | Madrid Margaret | $216,422 | |
| Previous Owner | Madrid Margaret | -- |
Source: Public Records
Tax History Compared to Growth
Tax History
| Year | Tax Paid | Tax Assessment Tax Assessment Total Assessment is a certain percentage of the fair market value that is determined by local assessors to be the total taxable value of land and additions on the property. | Land | Improvement |
|---|---|---|---|---|
| 2025 | $1,778 | $91,374 | $26,740 | $64,634 |
| 2024 | $1,778 | $88,713 | $25,961 | $62,752 |
| 2023 | $1,773 | $86,129 | $25,205 | $60,924 |
| 2022 | $3,301 | $83,621 | $24,471 | $59,150 |
| 2021 | $2,618 | $81,186 | $23,759 | $57,427 |
| 2020 | $3,124 | $78,822 | $23,067 | $55,755 |
| 2019 | $1,279 | $76,526 | $22,395 | $54,131 |
| 2018 | $2,909 | $76,526 | $22,395 | $54,131 |
| 2017 | $2,812 | $74,297 | $21,743 | $52,554 |
| 2016 | $2,724 | $70,033 | $20,495 | $49,538 |
| 2015 | $67,993 | $67,993 | $19,898 | $48,095 |
| 2014 | $1,307 | $67,993 | $19,898 | $48,095 |
| 2013 | -- | $68,254 | $18,229 | $50,025 |
Source: Public Records
Map
Nearby Homes
- 4515 Millwood Ct NW
- 4820 Summersville Dr NW
- 4600 Waynesboro Place NW
- 4512 Waynesboro Rd NW
- 7939 Independence Dr NW
- 7824 Snowberry St NW
- 7809 Juneberry St NW
- 7739 Ridgeview Dr NW
- 7708 Ridgeview Dr NW
- 4309 Rancho Largo Rd NW
- 7516 Wells Fargo Trail NW
- 4320 La Paloma Rd NW
- 7532 Deerfield Rd NW
- 7557 Richmond Hill Rd NW
- 7432 Primrose Dr NW
- 0 Calle Nortena North W
- 5136 Roanoke Ave NW
- 5333 Roanoke Ave NW
- 4500 Samara Rd NW
- 4612 Lobelia Rd NW
- 4705 Lewisburg Ct NW
- 4708 Lewisburg Ct NW
- 4709 Lewisburg Ct NW
- 4712 Lewisburg Ct NW
- 8020 Harrisonburg Ct NW
- 8016 Harrisonburg Ct NW
- 4801 Summersville Dr NW
- 8009 Harrisonburg Ct NW
- 4716 Lewisburg Ct NW
- 8012 Harrisonburg Ct NW
- 4619 Waynesboro Place NW
- 4805 Summersville Dr NW
- 4623 Waynesboro Place NW
- 8008 Harrisonburg Ct NW
- 4615 Waynesboro Place NW
- 4523 Harpers Ferry Ct NW
- 8112 Lewisburg Dr NW
- 4611 Waynesboro Place NW
- 4809 Summersville Dr NW
- 8004 Harrisonburg Ct NW