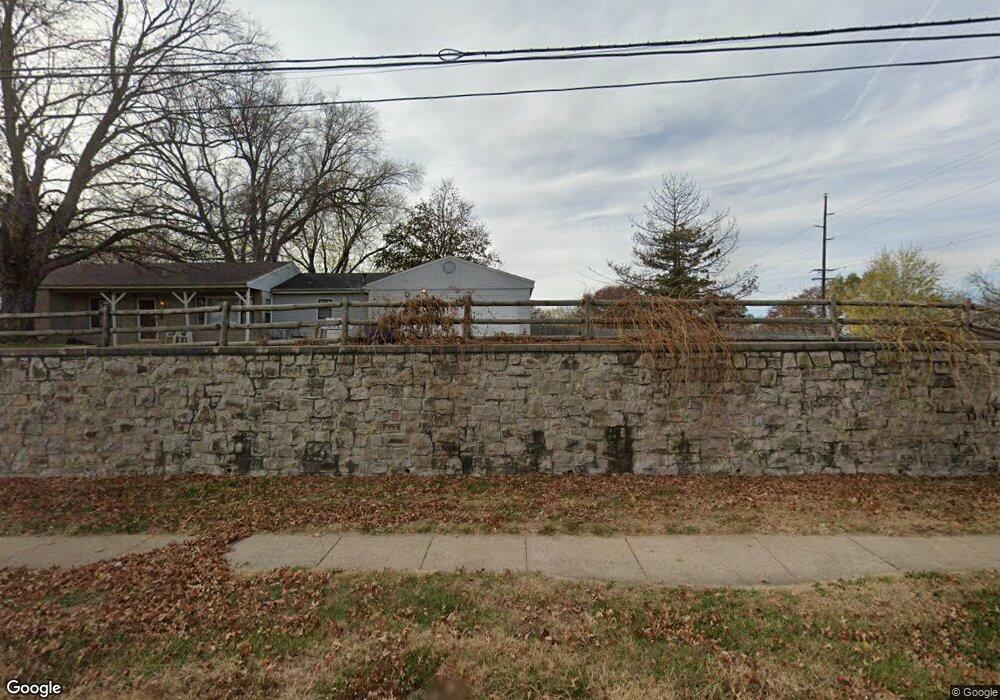
4702 Woodland Rd Shawnee, KS 66218
Estimated Value: $413,000 - $452,000
3
Beds
2
Baths
1,564
Sq Ft
$272/Sq Ft
Est. Value
About This Home
This home is located at 4702 Woodland Rd, Shawnee, KS 66218 and is currently estimated at $425,753, approximately $272 per square foot. 4702 Woodland Rd is a home located in Johnson County with nearby schools including Riverview Elementary School, Mill Creek Middle School, and Mill Valley High School.
Ownership History
Date
Name
Owned For
Owner Type
Purchase Details
Closed on
Feb 24, 2021
Sold by
Babcock Terese Adele
Bought by
Babcock Carlton Edwin
Current Estimated Value
Purchase Details
Closed on
Feb 20, 2021
Sold by
Babcock Terese Adele and Babcock Carlton Edwin
Bought by
Babcock Carlton Edwin and Babcock Terese Adele
Purchase Details
Closed on
Nov 5, 2020
Sold by
Babcock Carlton E and Babcock Teresa A
Bought by
Babcock Carlton Edwin
Home Financials for this Owner
Home Financials are based on the most recent Mortgage that was taken out on this home.
Original Mortgage
$203,110
Interest Rate
2.8%
Mortgage Type
VA
Purchase Details
Closed on
Aug 25, 2003
Sold by
Babcock Carlton E and Babcock Terese A
Bought by
Babcock Carlton E and Babcock Terese A
Home Financials for this Owner
Home Financials are based on the most recent Mortgage that was taken out on this home.
Original Mortgage
$132,000
Interest Rate
6.31%
Mortgage Type
Purchase Money Mortgage
Create a Home Valuation Report for This Property
The Home Valuation Report is an in-depth analysis detailing your home's value as well as a comparison with similar homes in the area
Home Values in the Area
Average Home Value in this Area
Purchase History
| Date | Buyer | Sale Price | Title Company |
|---|---|---|---|
| Babcock Carlton Edwin | -- | None Listed On Document | |
| Babcock Carlton Edwin | -- | None Available | |
| Babcock Carlton Edwin | -- | None Available | |
| Babcock Carlton E | -- | Chicago Title Insurance Comp |
Source: Public Records
Mortgage History
| Date | Status | Borrower | Loan Amount |
|---|---|---|---|
| Previous Owner | Babcock Carlton Edwin | $203,110 | |
| Previous Owner | Babcock Carlton E | $132,000 |
Source: Public Records
Tax History Compared to Growth
Tax History
| Year | Tax Paid | Tax Assessment Tax Assessment Total Assessment is a certain percentage of the fair market value that is determined by local assessors to be the total taxable value of land and additions on the property. | Land | Improvement |
|---|---|---|---|---|
| 2024 | $4,760 | $41,061 | $16,807 | $24,254 |
| 2023 | $4,529 | $38,556 | $14,243 | $24,313 |
| 2022 | $3,772 | $31,478 | $11,876 | $19,602 |
| 2021 | $3,894 | $31,146 | $11,384 | $19,762 |
| 2020 | $3,365 | $26,650 | $11,384 | $15,266 |
| 2019 | $3,246 | $25,325 | $11,384 | $13,941 |
| 2018 | $3,091 | $23,895 | $11,384 | $12,511 |
| 2017 | $3,098 | $23,366 | $11,384 | $11,982 |
| 2016 | $3,081 | $22,952 | $11,384 | $11,568 |
| 2015 | $2,993 | $21,987 | $11,384 | $10,603 |
| 2013 | -- | $21,162 | $11,384 | $9,778 |
Source: Public Records
Map
Nearby Homes
- 4531 Woodstock St
- 20823 W 45th Terrace
- 4754 Lakecrest Dr
- 21222 W 48th St
- 5015 Millbrook St
- 21408 W 50th St
- 4713 Lone Elm
- 22014 W 47th Terrace
- 5311 Brownridge Dr
- 240 White St Unit LOT 240
- 738 S 9th St
- 5405 Lakecrest Dr
- 22014 W 51st St
- 5116 Payne St
- 5307 Noble St
- 21804 W 52nd Terrace
- 21624 W 53rd Terrace
- 5206 Round Prairie St
- 22115 W 51st Terrace
- 21217 W 55th Terrace
- 20809 W 47th St
- 4730 Woodland Dr
- 20865 W 47th St
- 4820 Woodland Dr
- 4651 Millbrook Ct
- 20885 W 47th St
- 4645 Millbrook Ct
- 20720 W 47th St
- 4650 Millbrook Ct
- 4627 Millbrook Ct
- 4636 Woodstock St
- 20704 W 48th St
- 20700 W 48th St
- 4628 Millbrook Ct
- 20708 W 48th St
- 20802 W 48th St
- 4621 Millbrook Ct
- 4632 Woodstock St
- 20810 W 48th St
- 20904 W 48th St