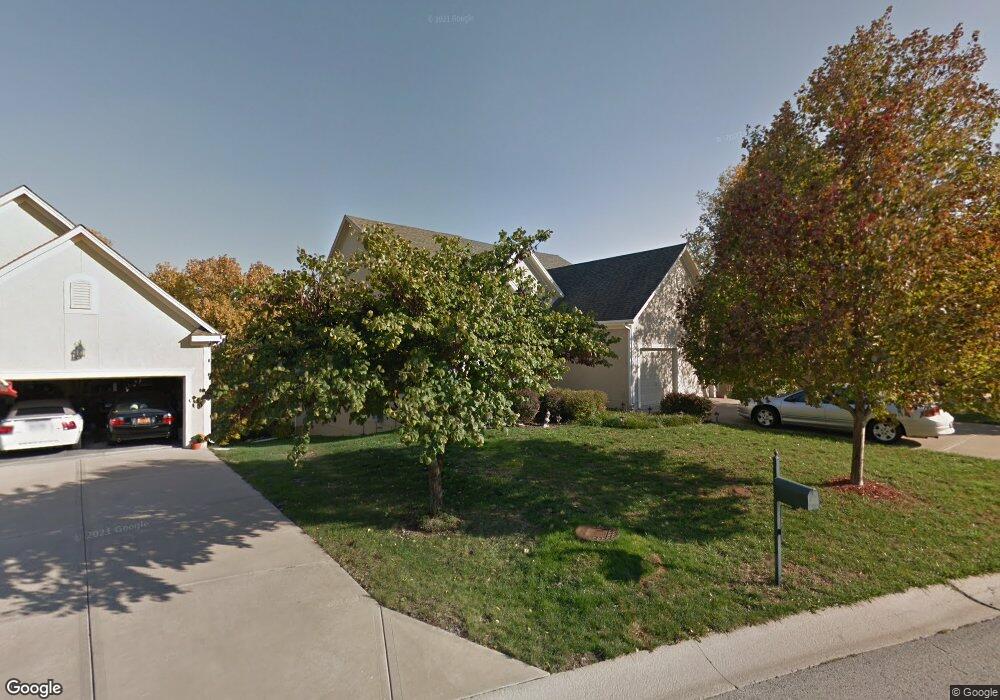
4705 Meadow View Dr Shawnee, KS 66226
Estimated Value: $476,131 - $503,000
5
Beds
4
Baths
2,079
Sq Ft
$237/Sq Ft
Est. Value
About This Home
This home is located at 4705 Meadow View Dr, Shawnee, KS 66226 and is currently estimated at $492,533, approximately $236 per square foot. 4705 Meadow View Dr is a home located in Johnson County with nearby schools including Riverview Elementary School, Mill Creek Middle School, and Mill Valley High School.
Ownership History
Date
Name
Owned For
Owner Type
Purchase Details
Closed on
Jan 22, 2006
Sold by
Vanstechelman Gregory L and Vanstechelman Pamela A
Bought by
Mahin John M and Mahin Judith M
Current Estimated Value
Home Financials for this Owner
Home Financials are based on the most recent Mortgage that was taken out on this home.
Original Mortgage
$190,000
Outstanding Balance
$106,605
Interest Rate
6.24%
Mortgage Type
New Conventional
Estimated Equity
$385,928
Purchase Details
Closed on
Apr 10, 2003
Sold by
Pflumm Contracting Inc
Bought by
Vanstechelman Gregory L and Vanstechelman Pamela A
Home Financials for this Owner
Home Financials are based on the most recent Mortgage that was taken out on this home.
Original Mortgage
$215,159
Interest Rate
4.87%
Create a Home Valuation Report for This Property
The Home Valuation Report is an in-depth analysis detailing your home's value as well as a comparison with similar homes in the area
Home Values in the Area
Average Home Value in this Area
Purchase History
| Date | Buyer | Sale Price | Title Company |
|---|---|---|---|
| Mahin John M | -- | Kansas City Title | |
| Vanstechelman Gregory L | -- | Security Land Title Company |
Source: Public Records
Mortgage History
| Date | Status | Borrower | Loan Amount |
|---|---|---|---|
| Open | Mahin John M | $190,000 | |
| Previous Owner | Vanstechelman Gregory L | $215,159 | |
| Closed | Vanstechelman Gregory L | $53,791 |
Source: Public Records
Tax History Compared to Growth
Tax History
| Year | Tax Paid | Tax Assessment Tax Assessment Total Assessment is a certain percentage of the fair market value that is determined by local assessors to be the total taxable value of land and additions on the property. | Land | Improvement |
|---|---|---|---|---|
| 2024 | $6,327 | $54,303 | $8,139 | $46,164 |
| 2023 | $6,101 | $51,865 | $8,139 | $43,726 |
| 2022 | $5,353 | $44,597 | $7,081 | $37,516 |
| 2021 | $5,041 | $40,388 | $6,438 | $33,950 |
| 2020 | $5,022 | $39,871 | $6,438 | $33,433 |
| 2019 | $4,883 | $38,203 | $5,382 | $32,821 |
| 2018 | $4,702 | $36,455 | $5,382 | $31,073 |
| 2017 | $4,712 | $35,639 | $5,382 | $30,257 |
| 2016 | $4,655 | $34,776 | $5,382 | $29,394 |
| 2015 | $4,647 | $34,098 | $5,382 | $28,716 |
| 2013 | -- | $33,327 | $5,382 | $27,945 |
Source: Public Records
Map
Nearby Homes
- 22912 W 47th Terrace
- 22611 W 46th Terrace
- 22714 W 49th St
- 4403 Silverheel St
- 4638 Aminda St
- 22625 W 49th St
- 22910 W 51st St
- 4420 Anderson St
- 9307 Aminda St
- 9303 Aminda St
- 9313 Aminda St
- 9305 Aminda St
- 5005 Hilltop Dr
- 5137 Meadowlark Dr
- 5221 Meadow View Dr
- 22014 W 47th Terrace
- 22014 W 51st St
- 5116 Payne St
- 22115 W 51st Terrace
- 5206 Round Prairie St
- 4709 Meadow View Dr
- 4701 Meadow View Dr
- 4713 Meadow View Dr
- 4704 Meadow View Dr
- 4700 Meadow View Dr
- 4717 Meadow View Dr
- 4708 Meadow View Dr
- 4712 Meadow View Dr
- 4716 Meadow View Dr
- 4721 Meadow View Dr
- 23117 W 46th Terrace
- 23109 W 46th Terrace
- 4720 Meadow View Dr
- 23201 W 46th Terrace
- 4725 Meadow View Dr
- 4724 Meadow View Dr
- 4729 Meadow View Dr
- 23104 W 46th Terrace
- 4700 Grove St
- 4728 Meadow View Dr