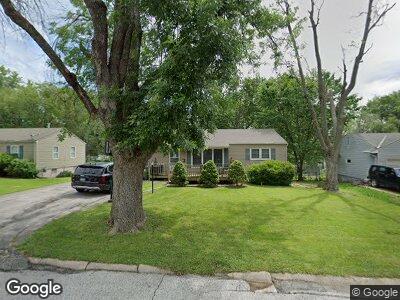
4705 S Fuller Ave Independence, MO 64055
Chapel NeighborhoodEstimated Value: $184,000 - $213,000
3
Beds
2
Baths
912
Sq Ft
$214/Sq Ft
Est. Value
About This Home
This home is located at 4705 S Fuller Ave, Independence, MO 64055 and is currently estimated at $195,367, approximately $214 per square foot. 4705 S Fuller Ave is a home located in Jackson County with nearby schools including Fleetridge Elementary School, Raytown Middle School, and Raytown South High School.
Ownership History
Date
Name
Owned For
Owner Type
Purchase Details
Closed on
Apr 26, 2010
Sold by
Sherwood Enterprises Llc
Bought by
Bockelman Samantha J and Shelton Jarad R
Current Estimated Value
Home Financials for this Owner
Home Financials are based on the most recent Mortgage that was taken out on this home.
Original Mortgage
$85,424
Interest Rate
5.5%
Mortgage Type
FHA
Purchase Details
Closed on
Feb 13, 2009
Sold by
Fannie Mae
Bought by
Sherwood Enterprises Llc
Purchase Details
Closed on
Nov 12, 2008
Sold by
Homesales Inc
Bought by
Federal National Mortgage Association
Purchase Details
Closed on
Aug 21, 2008
Sold by
Mcdaniel Rhonda S
Bought by
Homesales Inc and Homesales Of Delaware Inc
Create a Home Valuation Report for This Property
The Home Valuation Report is an in-depth analysis detailing your home's value as well as a comparison with similar homes in the area
Home Values in the Area
Average Home Value in this Area
Purchase History
| Date | Buyer | Sale Price | Title Company |
|---|---|---|---|
| Bockelman Samantha J | -- | Stewart Title Company | |
| Sherwood Enterprises Llc | -- | None Available | |
| Federal National Mortgage Association | -- | Continental Title Company | |
| Homesales Inc | $85,299 | Continental Title Company |
Source: Public Records
Mortgage History
| Date | Status | Borrower | Loan Amount |
|---|---|---|---|
| Open | Shelton Samantha | $105,620 | |
| Closed | Shelton Samantha | $101,781 | |
| Closed | Shelton Jarad R | $85,424 | |
| Previous Owner | Sherwood Enterprises Llc | $54,000 | |
| Previous Owner | Mcdaniel Rhonda S | $10,170 |
Source: Public Records
Tax History Compared to Growth
Tax History
| Year | Tax Paid | Tax Assessment Tax Assessment Total Assessment is a certain percentage of the fair market value that is determined by local assessors to be the total taxable value of land and additions on the property. | Land | Improvement |
|---|---|---|---|---|
| 2024 | $2,223 | $27,877 | $3,260 | $24,617 |
| 2023 | $2,223 | $27,877 | $3,308 | $24,569 |
| 2022 | $1,367 | $16,530 | $3,708 | $12,822 |
| 2021 | $1,366 | $16,530 | $3,708 | $12,822 |
| 2020 | $1,386 | $16,537 | $3,708 | $12,829 |
| 2019 | $1,373 | $16,537 | $3,708 | $12,829 |
| 2018 | $1,202 | $14,392 | $3,227 | $11,165 |
| 2017 | $1,202 | $14,392 | $3,227 | $11,165 |
| 2016 | $1,167 | $14,032 | $2,544 | $11,488 |
| 2014 | $1,139 | $13,623 | $2,470 | $11,153 |
Source: Public Records
Map
Nearby Homes
- 12202 E 47th Terrace S
- 12016 E 49th St S
- 4503 S Willis Ave
- 5000 Blue Ridge Blvd
- 4624 Norwood Ct
- 4705 Vermont Ave
- 12401 E 51st St S
- 19255 E 50 Terrace S
- 11400 E 49th St
- 11312 E 48th Terrace
- 5012 S Cottage Ave
- 5118 S Fuller Dr
- 13106 E 49th St S
- 4408 Norwood Ave
- 4512 Claremont Ave
- 5332 S Spring St
- 5124 S Cottage Ave
- 12500 E 52nd Terrace S
- 4508 Crisp Ave
- 5001 George Ave
- 4705 S Fuller Ave
- 4707 S Fuller Ave
- 4703 S Fuller Ave
- 4701 S Fuller Ave
- 4709 S Fuller Ave
- 4702 S Crysler Ave
- 4702 S Fuller Ave
- 4704 S Fuller Ave
- 4706 S Crysler Ave
- 4706 S Fuller Ave
- 4704 S Crysler Ave
- 4700 S Fuller Ave
- 4708 S Fuller Ave
- 4711 S Fuller Ave
- 4700 S Crysler Ave
- 12112 E 47th St S
- 4708 S Crysler Ave
- 12120 E 47th St S
- 4703 S Crysler Ave
- 4705 S Crysler Ave