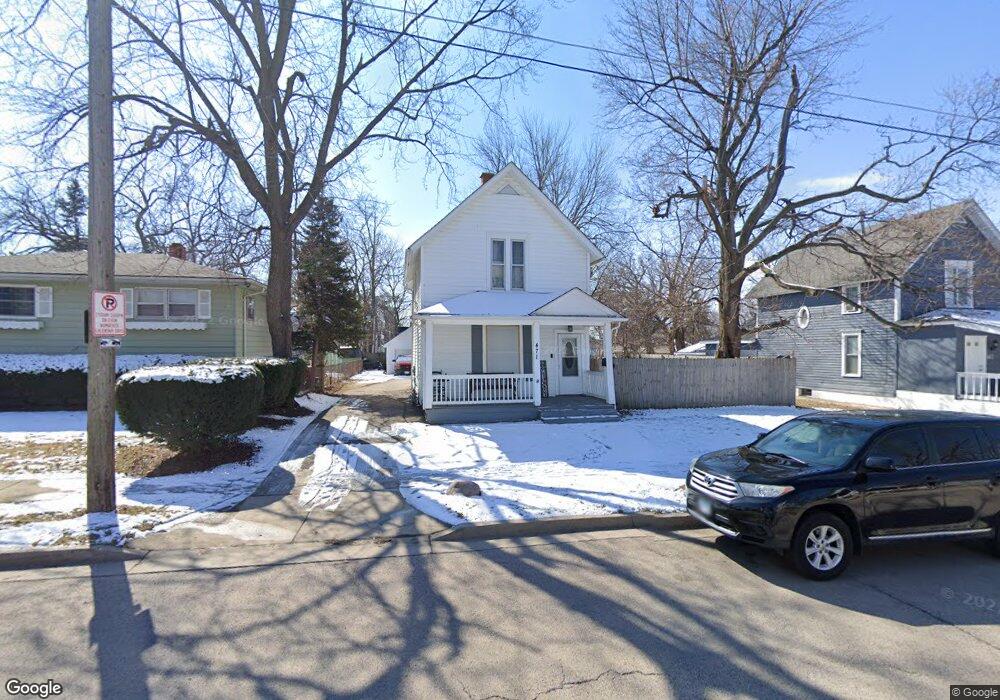
471 Franklin Blvd Elgin, IL 60120
Northeast Elgin NeighborhoodEstimated Value: $242,000 - $285,000
3
Beds
2
Baths
1,300
Sq Ft
$207/Sq Ft
Est. Value
About This Home
This home is located at 471 Franklin Blvd, Elgin, IL 60120 and is currently estimated at $269,687, approximately $207 per square foot. 471 Franklin Blvd is a home located in Kane County with nearby schools including Ronald D O'Neal Elementary School, Larsen Middle School, and Elgin High School.
Ownership History
Date
Name
Owned For
Owner Type
Purchase Details
Closed on
Mar 22, 2021
Sold by
Cruz Samuel Breban and Negron Darlene Echevarria
Bought by
Cruz Samuel Breban and Breban Darlene
Current Estimated Value
Home Financials for this Owner
Home Financials are based on the most recent Mortgage that was taken out on this home.
Original Mortgage
$116,250
Outstanding Balance
$95,265
Interest Rate
3.37%
Mortgage Type
New Conventional
Estimated Equity
$174,422
Purchase Details
Closed on
Nov 23, 2010
Sold by
Ellett Matthew L
Bought by
Cruz Samuel Breban and Negron Darlene Echevarria
Home Financials for this Owner
Home Financials are based on the most recent Mortgage that was taken out on this home.
Original Mortgage
$127,094
Interest Rate
4.75%
Mortgage Type
FHA
Purchase Details
Closed on
May 7, 2010
Sold by
Marko Monica M and Marko John M
Bought by
Ellett Matthew L
Create a Home Valuation Report for This Property
The Home Valuation Report is an in-depth analysis detailing your home's value as well as a comparison with similar homes in the area
Home Values in the Area
Average Home Value in this Area
Purchase History
| Date | Buyer | Sale Price | Title Company |
|---|---|---|---|
| Cruz Samuel Breban | -- | Servicelink | |
| Cruz Samuel Breban | $130,500 | First American Title | |
| Ellett Matthew L | $40,000 | Chicago Title Insurance Co |
Source: Public Records
Mortgage History
| Date | Status | Borrower | Loan Amount |
|---|---|---|---|
| Open | Cruz Samuel Breban | $116,250 | |
| Closed | Cruz Samuel Breban | $127,094 |
Source: Public Records
Tax History
| Year | Tax Paid | Tax Assessment Tax Assessment Total Assessment is a certain percentage of the fair market value that is determined by local assessors to be the total taxable value of land and additions on the property. | Land | Improvement |
|---|---|---|---|---|
| 2024 | $4,989 | $70,339 | $15,342 | $54,997 |
| 2023 | $4,735 | $63,546 | $13,860 | $49,686 |
| 2022 | $4,504 | $57,943 | $12,638 | $45,305 |
| 2021 | $4,298 | $54,173 | $11,816 | $42,357 |
| 2020 | $3,994 | $49,790 | $11,280 | $38,510 |
| 2019 | $3,869 | $47,428 | $10,745 | $36,683 |
| 2018 | $3,446 | $40,856 | $10,122 | $30,734 |
| 2017 | $3,356 | $38,624 | $9,569 | $29,055 |
| 2016 | $3,182 | $35,832 | $8,877 | $26,955 |
| 2015 | -- | $32,844 | $8,137 | $24,707 |
| 2014 | -- | $32,439 | $8,037 | $24,402 |
| 2013 | -- | $37,715 | $8,249 | $29,466 |
Source: Public Records
Map
Nearby Homes
- 453 Addison St
- 268 N Gifford St
- 363 Franklin Blvd
- 131 N Gifford St
- 371 North St
- 115 N Porter St
- 409 Algona Ave
- 464 Prospect St
- 601 Columbia Ave
- 120 N Spring St
- 58 S Geneva St
- 603 Douglas Ave
- 211 Prairie St
- 920 Augusta Ave
- 833 Forest Ave
- 162 Festival Ct
- 277 Gifford Place
- 286 Villa St
- 483 Barrett St
- 841 Douglas Ave
- 467 Franklin Blvd
- 475 Franklin Blvd
- 463 Franklin Blvd
- 477 Franklin Blvd
- 461 Franklin Blvd
- 466 Addison St
- 470 Addison St
- 464 Addison St
- 459 Franklin Blvd
- 474 Addison St
- 474 Addison St Unit 2
- 485 Franklin Blvd
- 460 Addison St
- 480 Addison St
- 457 Franklin Blvd
- 472 Franklin Blvd
- 466 Franklin Blvd
- 476 Franklin Blvd
- 462 Franklin Blvd
- 478 Franklin Blvd
Your Personal Tour Guide
Ask me questions while you tour the home.