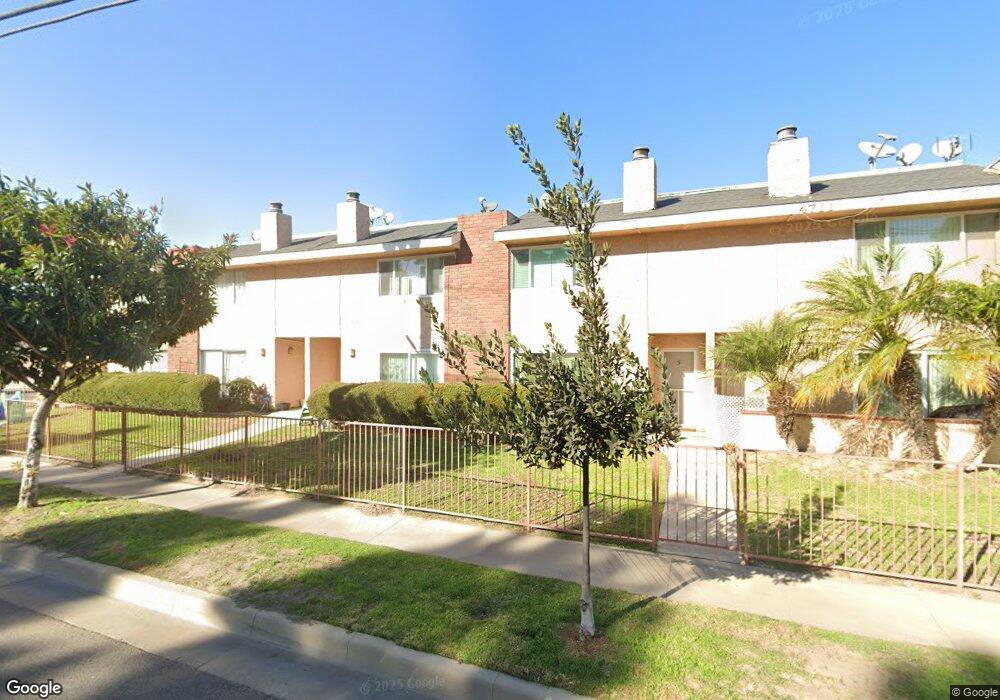
4711 Crescent Ave Unit 2 Cypress, CA 90630
Estimated Value: $636,000 - $686,542
2
Beds
1
Bath
1,190
Sq Ft
$557/Sq Ft
Est. Value
About This Home
This home is located at 4711 Crescent Ave Unit 2, Cypress, CA 90630 and is currently estimated at $663,386, approximately $557 per square foot. 4711 Crescent Ave Unit 2 is a home located in Orange County with nearby schools including Steve Luther Elementary School, Walker Junior High School, and John F. Kennedy High School.
Ownership History
Date
Name
Owned For
Owner Type
Purchase Details
Closed on
Sep 8, 2005
Sold by
Lee Moon C and Lee Joanna S
Bought by
Lumbantobing Maringan and Suparmo Thiorina
Current Estimated Value
Purchase Details
Closed on
Jun 22, 2005
Sold by
Lee Moon C and Lee Joanna S
Bought by
Lumbantobing Maringan and Suparmo Thiorina
Home Financials for this Owner
Home Financials are based on the most recent Mortgage that was taken out on this home.
Original Mortgage
$70,980
Interest Rate
5.58%
Mortgage Type
Credit Line Revolving
Purchase Details
Closed on
May 31, 2002
Sold by
Baer M Diane
Bought by
Lee Moon C and Lee Joanna S
Home Financials for this Owner
Home Financials are based on the most recent Mortgage that was taken out on this home.
Original Mortgage
$175,275
Interest Rate
5.75%
Create a Home Valuation Report for This Property
The Home Valuation Report is an in-depth analysis detailing your home's value as well as a comparison with similar homes in the area
Home Values in the Area
Average Home Value in this Area
Purchase History
| Date | Buyer | Sale Price | Title Company |
|---|---|---|---|
| Lumbantobing Maringan | -- | Old Republic Title Co O C | |
| Lumbantobing Maringan | $355,000 | Old Republic Title Company | |
| Lee Moon C | $184,500 | Fidelity National Title |
Source: Public Records
Mortgage History
| Date | Status | Borrower | Loan Amount |
|---|---|---|---|
| Previous Owner | Lumbantobing Maringan | $70,980 | |
| Previous Owner | Lumbantobing Maringan | $283,920 | |
| Previous Owner | Lee Moon C | $175,275 |
Source: Public Records
Tax History
| Year | Tax Paid | Tax Assessment Tax Assessment Total Assessment is a certain percentage of the fair market value that is determined by local assessors to be the total taxable value of land and additions on the property. | Land | Improvement |
|---|---|---|---|---|
| 2025 | $5,577 | $494,689 | $363,227 | $131,462 |
| 2024 | $5,577 | $484,990 | $356,105 | $128,885 |
| 2023 | $4,693 | $405,756 | $303,665 | $102,091 |
| 2022 | $4,636 | $397,800 | $297,710 | $100,090 |
| 2021 | $4,574 | $390,000 | $291,872 | $98,128 |
| 2020 | $4,600 | $390,000 | $291,872 | $98,128 |
| 2019 | $4,555 | $390,000 | $291,872 | $98,128 |
| 2018 | $4,578 | $390,000 | $291,872 | $98,128 |
| 2017 | $4,287 | $370,000 | $271,872 | $98,128 |
| 2016 | $4,099 | $349,000 | $250,872 | $98,128 |
| 2015 | $3,915 | $330,000 | $231,872 | $98,128 |
| 2014 | $3,298 | $285,000 | $186,872 | $98,128 |
Source: Public Records
Map
Nearby Homes
- 8342 Fontainbleau Way
- 8326 Fontainbleau Way
- 4891 Grace Ave
- 8689 Moody St
- 8521 Via Tina
- 8762 La Salle St
- 4932 Windsong Ave
- 8032 Lancashire Cir
- 12750 Centralia St Unit 76
- 4282 Crystal Cir
- 5201 Del Serra Cir
- 9066 Candlestick Ln Unit 5
- 8792 Grindlay St
- 21108 Wilder Ave
- 8622 Watson St
- 4841 Sharon Dr
- 9220 Whitney Way
- 9080 Bloomfield Ave
- 9080 Bloomfield Ave
- 9080 Bloomfield Ave Unit 257
- 4711 Crescent Ave Unit 8
- 4711 Crescent Ave Unit 6
- 4711 Crescent Ave Unit 4
- 4711 Crescent Ave Unit 5
- 4711 Crescent Ave Unit 7
- 4711 Crescent Ave Unit 3
- 4711 Crescent Ave Unit 1
- 8479 Cedarview Ct
- 8483 Cedarview Ct
- 8485 Cedarview Ct
- 8487 Cedarview Ct
- 4731 Crescent Ave
- 4692 Simone Way
- 4682 Simone Way
- 4702 Simone Way
- 8489 Cedarview Ct Unit 4
- 8451 Cedarview Ct
- 8457 Cedarview Ct
- 8467 Cedarview Ct
- 8471 Cedarview Ct
Your Personal Tour Guide
Ask me questions while you tour the home.