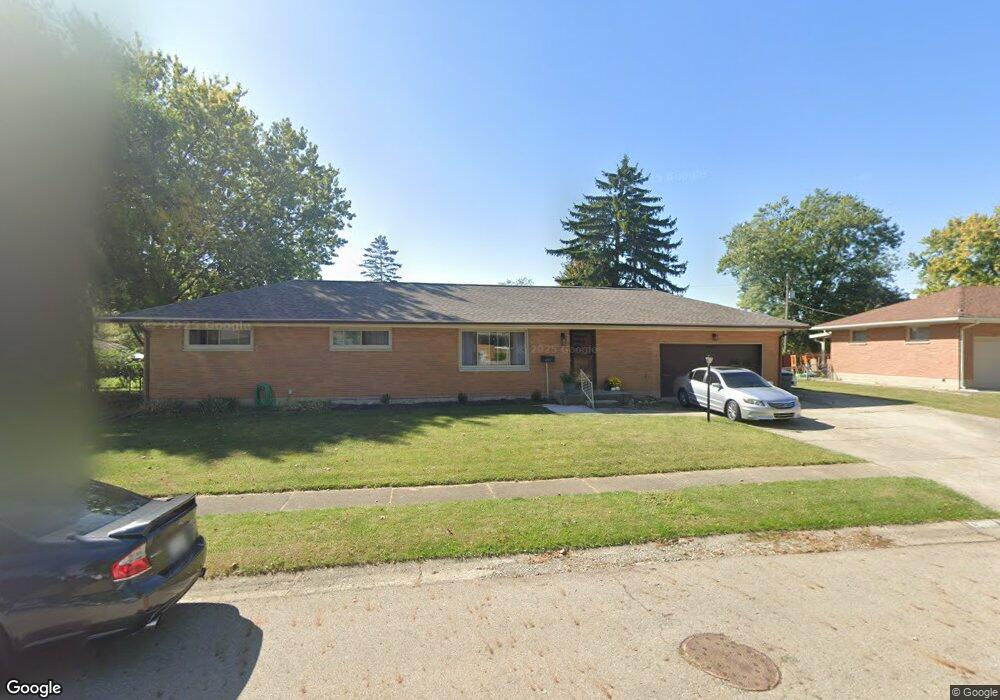
4711 Merrimont Ave Springfield, OH 45503
Estimated Value: $199,000 - $252,000
3
Beds
2
Baths
1,325
Sq Ft
$170/Sq Ft
Est. Value
About This Home
This home is located at 4711 Merrimont Ave, Springfield, OH 45503 and is currently estimated at $225,892, approximately $170 per square foot. 4711 Merrimont Ave is a home located in Clark County with nearby schools including Rolling Hills Elementary School, Northridge Elementary School, and Northridge Middle School.
Ownership History
Date
Name
Owned For
Owner Type
Purchase Details
Closed on
Mar 10, 2021
Sold by
Russell Jill L and Lethcoe Tracy G
Bought by
Smith Brian L and Smith Wendee L
Current Estimated Value
Home Financials for this Owner
Home Financials are based on the most recent Mortgage that was taken out on this home.
Original Mortgage
$118,750
Outstanding Balance
$106,451
Interest Rate
2.7%
Mortgage Type
New Conventional
Estimated Equity
$119,441
Create a Home Valuation Report for This Property
The Home Valuation Report is an in-depth analysis detailing your home's value as well as a comparison with similar homes in the area
Home Values in the Area
Average Home Value in this Area
Purchase History
| Date | Buyer | Sale Price | Title Company |
|---|---|---|---|
| Smith Brian L | $125,000 | None Available |
Source: Public Records
Mortgage History
| Date | Status | Borrower | Loan Amount |
|---|---|---|---|
| Open | Smith Brian L | $118,750 |
Source: Public Records
Tax History Compared to Growth
Tax History
| Year | Tax Paid | Tax Assessment Tax Assessment Total Assessment is a certain percentage of the fair market value that is determined by local assessors to be the total taxable value of land and additions on the property. | Land | Improvement |
|---|---|---|---|---|
| 2024 | $2,287 | $52,890 | $12,160 | $40,730 |
| 2023 | $2,287 | $52,890 | $12,160 | $40,730 |
| 2022 | $2,296 | $52,890 | $12,160 | $40,730 |
| 2021 | $1,938 | $37,840 | $9,650 | $28,190 |
| 2020 | $1,458 | $37,840 | $9,650 | $28,190 |
| 2019 | $1,486 | $37,840 | $9,650 | $28,190 |
| 2018 | $1,611 | $39,020 | $8,650 | $30,370 |
| 2017 | $1,380 | $39,684 | $8,649 | $31,035 |
| 2016 | $1,371 | $39,684 | $8,649 | $31,035 |
| 2015 | $699 | $37,552 | $8,316 | $29,236 |
| 2014 | $1,398 | $37,552 | $8,316 | $29,236 |
| 2013 | $683 | $37,552 | $8,316 | $29,236 |
Source: Public Records
Map
Nearby Homes
- 4721 Merrimont Ave
- 4703 Merrimont Ave
- 4712 Chippendale Dr
- 4722 Chippendale Dr
- 1706 Biscayne Dr
- 4714 Merrimont Ave
- 4730 Chippendale Dr
- 4704 Merrimont Ave
- 4731 Merrimont Ave
- 4728 Merrimont Ave
- 4740 Chippendale Dr
- 1717 Biscayne Dr
- 4709 Mesa Ln
- 1727 Biscayne Dr
- 4701 Mesa Ln
- 1709 Biscayne Dr
- 4741 Merrimont Ave
- 4709 Chippendale Dr
- 4717 Chippendale Dr
- 1638 Biscayne Dr