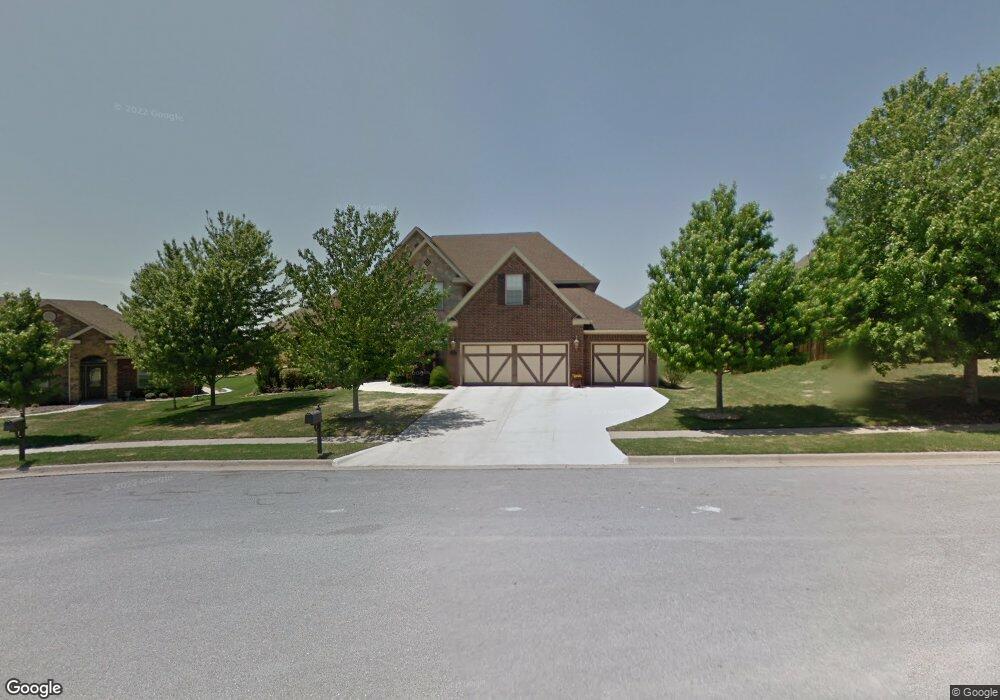
4713 Mossy Oak Trail Rogers, AR 72758
Estimated Value: $700,000 - $754,000
--
Bed
5
Baths
3,384
Sq Ft
$212/Sq Ft
Est. Value
About This Home
This home is located at 4713 Mossy Oak Trail, Rogers, AR 72758 and is currently estimated at $718,111, approximately $212 per square foot. 4713 Mossy Oak Trail is a home located in Benton County with nearby schools including Janie Darr Elementary School, Elmwood Middle School, and Rogers High School.
Ownership History
Date
Name
Owned For
Owner Type
Purchase Details
Closed on
Dec 16, 2019
Sold by
Witte Nathaniel Gregg and Witte Arianna
Bought by
Brittain Sarah E and Clark Christopher
Current Estimated Value
Home Financials for this Owner
Home Financials are based on the most recent Mortgage that was taken out on this home.
Original Mortgage
$284,000
Outstanding Balance
$192,753
Interest Rate
3.6%
Mortgage Type
New Conventional
Estimated Equity
$525,358
Purchase Details
Closed on
Feb 15, 2017
Sold by
Cicatiello Michael Thomas and Cicatiello Deanna Jo
Bought by
Gregg Nathaniel and Witte Arianna
Purchase Details
Closed on
Aug 22, 2005
Sold by
Cooper Homes Inc
Bought by
Cicatiello Michael Thomas and Cicatiello Deanna Jo
Home Financials for this Owner
Home Financials are based on the most recent Mortgage that was taken out on this home.
Original Mortgage
$35,800
Interest Rate
5.81%
Mortgage Type
Future Advance Clause Open End Mortgage
Create a Home Valuation Report for This Property
The Home Valuation Report is an in-depth analysis detailing your home's value as well as a comparison with similar homes in the area
Home Values in the Area
Average Home Value in this Area
Purchase History
| Date | Buyer | Sale Price | Title Company |
|---|---|---|---|
| Brittain Sarah E | $355,000 | Realty Ttl & Closing Svcs Ll | |
| Gregg Nathaniel | $365,000 | None Available | |
| Cicatiello Michael Thomas | $447,000 | Waco Title Company |
Source: Public Records
Mortgage History
| Date | Status | Borrower | Loan Amount |
|---|---|---|---|
| Open | Brittain Sarah E | $284,000 | |
| Previous Owner | Cicatiello Michael Thomas | $35,800 | |
| Previous Owner | Cicatiello Michael Thomas | $357,400 |
Source: Public Records
Tax History Compared to Growth
Tax History
| Year | Tax Paid | Tax Assessment Tax Assessment Total Assessment is a certain percentage of the fair market value that is determined by local assessors to be the total taxable value of land and additions on the property. | Land | Improvement |
|---|---|---|---|---|
| 2024 | $4,737 | $126,767 | $20,000 | $106,767 |
| 2023 | $4,307 | $81,410 | $15,000 | $66,410 |
| 2022 | $4,478 | $81,410 | $15,000 | $66,410 |
| 2021 | $4,466 | $81,410 | $15,000 | $66,410 |
| 2020 | $4,354 | $79,310 | $8,600 | $70,710 |
| 2019 | $3,979 | $79,310 | $8,600 | $70,710 |
| 2018 | $4,004 | $79,310 | $8,600 | $70,710 |
| 2017 | $2,978 | $79,310 | $8,600 | $70,710 |
| 2016 | $2,978 | $79,310 | $8,600 | $70,710 |
| 2015 | $3,231 | $61,080 | $7,400 | $53,680 |
| 2014 | $2,881 | $61,080 | $7,400 | $53,680 |
Source: Public Records
Map
Nearby Homes
- 6400 S 46th Blvd
- 6510 S 49th St
- 5001 W Lakewood Ct
- 503 Driftwood St
- Single Family Portfo Group 1
- 635 Woodcreek Loop
- 505 Woodcreek Loop
- Single Family Portfo Group 2
- 6253 S Mount Hebron Rd
- 5501 W Bay Dr
- 6098 S Pack Ln
- 4587 W Garrett Rd
- 2504 Maplewood Ave
- 6099 S Pack Ln
- 4109 W Candlewood Place
- 6311 S 57th St
- 2709 Amaris Ave
- 401 Zion Church St
- 6401 S 42nd St
- 2713 Amaris Ave
- 4713 W Mossy Oak Trail
- 4711 Mossy Oak Trail
- 4715 W Mossy Oak Trail
- 6407 S 46th St
- 6409 S 46th St
- 6405 S 46th St
- 4717 W Mossy Oak Trail
- 4717 Mossy Oak Trail
- 4704 W Mossy Oak Trail
- 4709 Mossy Oak Trail
- 4710 W Mossy Oak Trail
- 4719 W Mossy Oak Trail
- 4721 Mossy Oak Trail
- 6411 S 46th St
- 4707 Mossy Oak Trail
- 4707 W Mossy Oak Trail
- 1279 Bayberry Place
- 4702 Mossy Oak Trail
- 4702 W Mossy Oak Trail
- 4601 W Langmead Dr