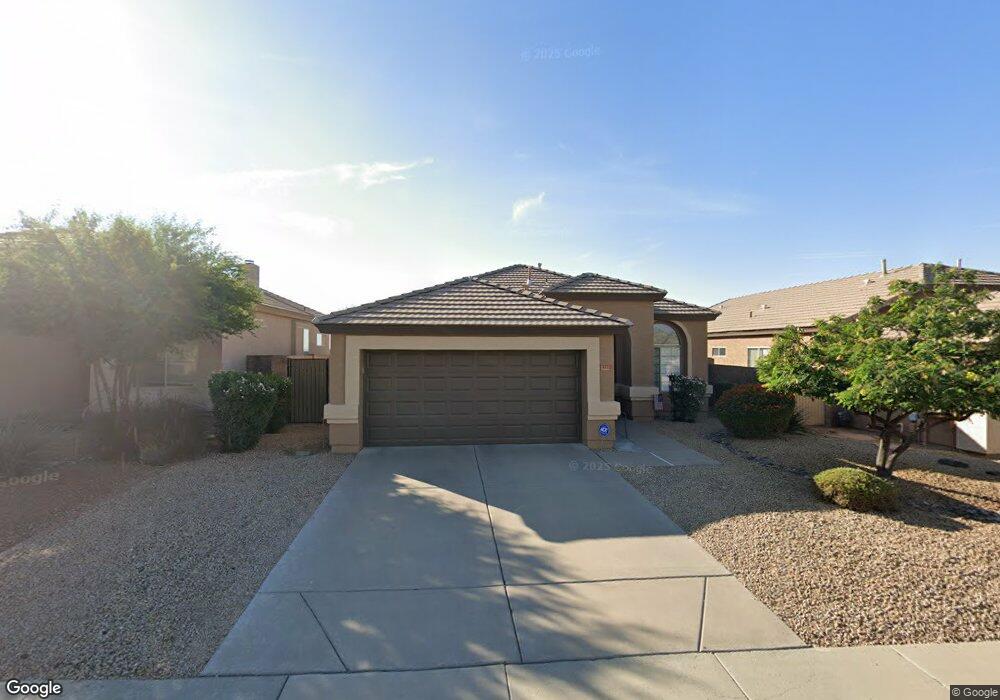
4715 E Prickly Pear Trail Phoenix, AZ 85050
Desert View NeighborhoodEstimated Value: $522,107 - $564,000
3
Beds
2
Baths
1,485
Sq Ft
$366/Sq Ft
Est. Value
About This Home
This home is located at 4715 E Prickly Pear Trail, Phoenix, AZ 85050 and is currently estimated at $544,027, approximately $366 per square foot. 4715 E Prickly Pear Trail is a home located in Maricopa County with nearby schools including Wildfire Elementary School, Explorer Middle School, and Pinnacle High School.
Ownership History
Date
Name
Owned For
Owner Type
Purchase Details
Closed on
Jan 18, 2021
Sold by
Iorio Magda and Iorio John
Bought by
Iorio Magda and Iorio John R
Current Estimated Value
Purchase Details
Closed on
May 26, 1999
Sold by
Marlowe Michael W
Bought by
Iorio John and Iorio Magda
Home Financials for this Owner
Home Financials are based on the most recent Mortgage that was taken out on this home.
Original Mortgage
$133,950
Outstanding Balance
$35,327
Interest Rate
7.05%
Mortgage Type
New Conventional
Estimated Equity
$508,700
Purchase Details
Closed on
Oct 5, 1994
Sold by
U S Home Corp
Bought by
Marlowe Michael W
Home Financials for this Owner
Home Financials are based on the most recent Mortgage that was taken out on this home.
Original Mortgage
$97,550
Interest Rate
8.12%
Mortgage Type
New Conventional
Create a Home Valuation Report for This Property
The Home Valuation Report is an in-depth analysis detailing your home's value as well as a comparison with similar homes in the area
Home Values in the Area
Average Home Value in this Area
Purchase History
| Date | Buyer | Sale Price | Title Company |
|---|---|---|---|
| Iorio Magda | -- | None Available | |
| Iorio John | $141,000 | Stewart Title & Trust | |
| Marlowe Michael W | $108,437 | Stewart Title & Trust |
Source: Public Records
Mortgage History
| Date | Status | Borrower | Loan Amount |
|---|---|---|---|
| Open | Iorio John | $133,950 | |
| Previous Owner | Marlowe Michael W | $97,550 |
Source: Public Records
Tax History Compared to Growth
Tax History
| Year | Tax Paid | Tax Assessment Tax Assessment Total Assessment is a certain percentage of the fair market value that is determined by local assessors to be the total taxable value of land and additions on the property. | Land | Improvement |
|---|---|---|---|---|
| 2025 | $2,401 | $27,725 | -- | -- |
| 2024 | $2,286 | $26,405 | -- | -- |
| 2023 | $2,286 | $35,370 | $7,070 | $28,300 |
| 2022 | $2,265 | $27,780 | $5,550 | $22,230 |
| 2021 | $2,302 | $26,650 | $5,330 | $21,320 |
| 2020 | $2,223 | $24,310 | $4,860 | $19,450 |
| 2019 | $2,233 | $23,060 | $4,610 | $18,450 |
| 2018 | $2,152 | $21,910 | $4,380 | $17,530 |
| 2017 | $2,055 | $20,810 | $4,160 | $16,650 |
| 2016 | $2,022 | $21,550 | $4,310 | $17,240 |
| 2015 | $1,876 | $19,430 | $3,880 | $15,550 |
Source: Public Records
Map
Nearby Homes
- 4714 E Prickly Pear Trail
- 26804 N 45th Place
- 4416 E Spur Dr
- 4331 E Prickly Pear Trail
- 4632 E Red Bird Rd
- 4224 E Spur Dr
- 26641 N 42nd St
- 4201 E Quail Track Dr
- 4601 E Pinnacle Vista Dr
- 26415 N 41st St
- 26811 N 41st Ct
- 25830 N 40th Place
- 4231 E Quail Track Dr
- 26807 N 56th St
- Xxxxx N 57th St
- 27566 N 56th Place
- 28305 N 44th Way
- 28305 N 42nd Way
- 4216 E Luther Ln
- 5677 E Hedgehog Place
- 4709 E Prickly Pear Trail
- 4719 E Prickly Pear Trail
- 4723 E Prickly Pear Trail
- 4705 E Prickly Pear Trail
- 25842 N 47th Place
- 4727 E Prickly Pear Trail
- 4708 E Prickly Pear Trail
- 25846 N 47th Place
- 4704 E Prickly Pear Trail
- 25837 N 47th Place
- 4702 E Prickly Pear Trail
- 25850 N 47th Place
- 4643 E Prickly Pear Trail
- 25841 N 47th Place
- 4907 E Prickly Pear Trail
- 4644 E Prickly Pear Trail
- 25845 N 47th Place
- 25856 N 47th Place
- 4715 E Paso Trail
- 4711 E Paso Trail