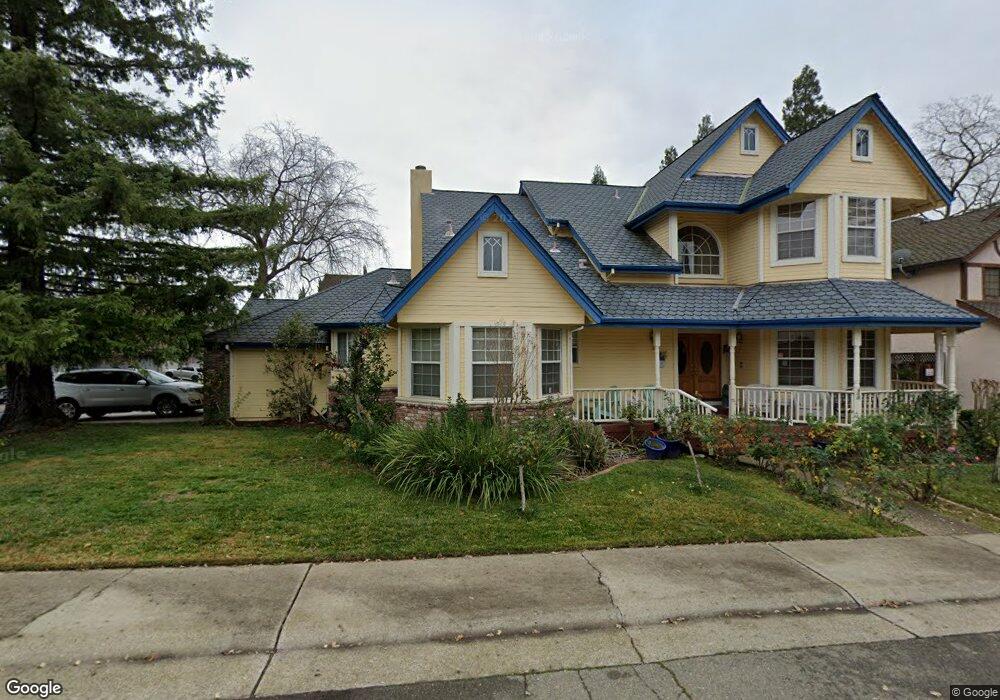
4716 Dea Way Fair Oaks, CA 95628
Estimated Value: $706,704 - $786,000
4
Beds
3
Baths
2,209
Sq Ft
$336/Sq Ft
Est. Value
About This Home
This home is located at 4716 Dea Way, Fair Oaks, CA 95628 and is currently estimated at $743,176, approximately $336 per square foot. 4716 Dea Way is a home located in Sacramento County with nearby schools including Albert Schweitzer Elementary School, John Barrett Middle School, and Del Campo High School.
Ownership History
Date
Name
Owned For
Owner Type
Purchase Details
Closed on
Aug 30, 2004
Sold by
Lewis Pamela A and Krajcar Terrance J
Bought by
Krajcar Terrance J and Lewis Pamela A
Current Estimated Value
Purchase Details
Closed on
Sep 6, 2003
Sold by
Lewis Pamela A and Krajcar Terrance J
Bought by
Krajcar Terrance J and Lewis Pamela A
Home Financials for this Owner
Home Financials are based on the most recent Mortgage that was taken out on this home.
Original Mortgage
$285,000
Outstanding Balance
$128,838
Interest Rate
5.87%
Mortgage Type
Purchase Money Mortgage
Estimated Equity
$614,338
Purchase Details
Closed on
Aug 15, 2000
Sold by
Hamer Janet
Bought by
Krajcar Terrance J and Lewis Pamela A
Home Financials for this Owner
Home Financials are based on the most recent Mortgage that was taken out on this home.
Original Mortgage
$250,000
Interest Rate
8.16%
Purchase Details
Closed on
May 31, 2000
Sold by
Hamer Jack
Bought by
Hamer Janet
Create a Home Valuation Report for This Property
The Home Valuation Report is an in-depth analysis detailing your home's value as well as a comparison with similar homes in the area
Home Values in the Area
Average Home Value in this Area
Purchase History
| Date | Buyer | Sale Price | Title Company |
|---|---|---|---|
| Krajcar Terrance J | -- | -- | |
| Krajcar Terrance J | -- | North American Title Co | |
| Krajcar Terrance J | $312,500 | Stewart Title | |
| Hamer Janet | -- | -- |
Source: Public Records
Mortgage History
| Date | Status | Borrower | Loan Amount |
|---|---|---|---|
| Open | Krajcar Terrance J | $285,000 | |
| Closed | Krajcar Terrance J | $250,000 |
Source: Public Records
Tax History Compared to Growth
Tax History
| Year | Tax Paid | Tax Assessment Tax Assessment Total Assessment is a certain percentage of the fair market value that is determined by local assessors to be the total taxable value of land and additions on the property. | Land | Improvement |
|---|---|---|---|---|
| 2025 | $5,616 | $470,868 | $113,000 | $357,868 |
| 2024 | $5,616 | $461,636 | $110,785 | $350,851 |
| 2023 | $5,452 | $452,585 | $108,613 | $343,972 |
| 2022 | $5,430 | $443,712 | $106,484 | $337,228 |
| 2021 | $5,323 | $435,013 | $104,397 | $330,616 |
| 2020 | $5,247 | $430,553 | $103,327 | $327,226 |
| 2019 | $5,112 | $422,111 | $101,301 | $320,810 |
| 2018 | $4,999 | $413,835 | $99,315 | $314,520 |
| 2017 | $4,948 | $405,721 | $97,368 | $308,353 |
| 2016 | $4,622 | $397,766 | $95,459 | $302,307 |
| 2015 | $4,541 | $391,793 | $94,026 | $297,767 |
| 2014 | $4,445 | $384,120 | $92,185 | $291,935 |
Source: Public Records
Map
Nearby Homes
- 7605 Sunset Ave
- 7657 Sunset Ave
- 7518 Westover Ct
- 7634 Pineridge Ln
- 7529 Pineridge Ln
- 4753 San Juan Ave
- 7518 Fairway Two Ave
- 7492 Fairway Two Ave
- 7400 San Nita Way
- 7440 Tierra Way
- 7736 Greenridge Way
- 7310 Cardinal Rd
- 7225 Zelinda Dr
- 7621 Palisade Way
- 4704 Johnson Dr
- 4040 Minnesota Ave
- 7832 Ahl Way
- 4339 Stencar Dr
- 4345 Bannister Rd
- 7201 Cardinal Rd