
Seller's Agent in 2026
Scott Vacek
Keller Williams Realty East Valley
(480) 779-7355
26 in this area
77 Total Sales
Estimated Value: $373,817 - $381,000
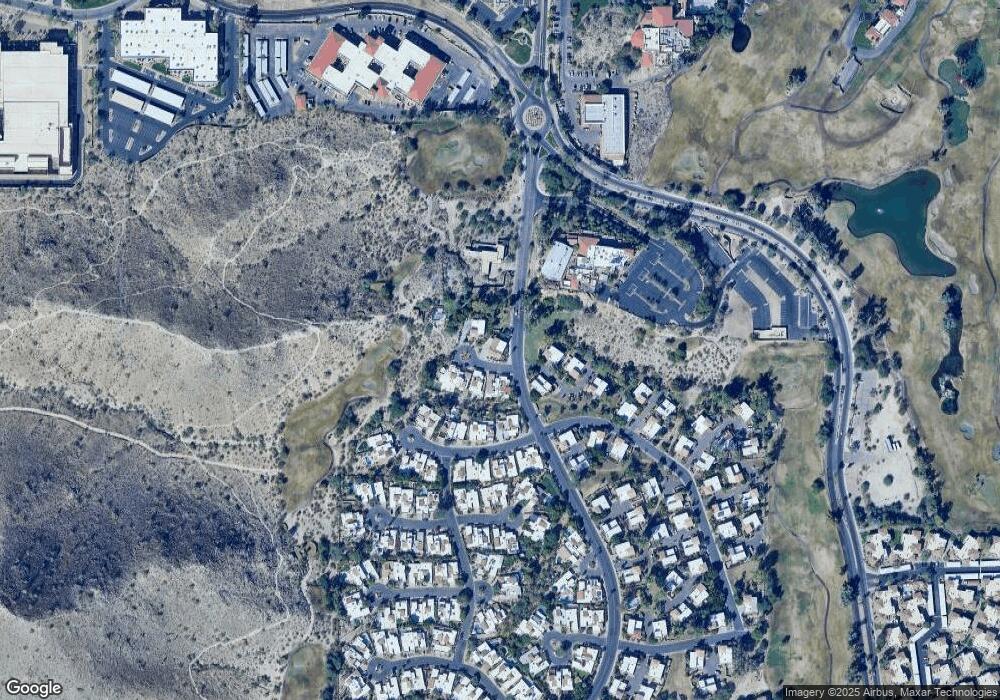
This home is located at 4716 E Caldwell St Unit 1, Phoenix, AZ 85044 and is currently estimated at $378,454, approximately $271 per square foot. 4716 E Caldwell St Unit 1 is a home located in Maricopa County with nearby schools including Frank Elementary School, Fees College Preparatory Middle School, and Mountain Pointe High School.
We collect this data history from publicly available records. To have your information removed, we recommend requesting removal directly through your county’s website.
We collect this data history from publicly available records. To have your information removed, we recommend requesting removal directly through your county’s website.
| Date | Buyer | Sale Price | Title Company |
|---|---|---|---|
| -- | None Available | ||
| $265,000 | Chicago Title | ||
| $299,000 | Fidelity National Title |
We collect this data history from publicly available records. To have your information removed, we recommend requesting removal directly through your county’s website.
| Date | Status | Borrower | Loan Amount |
|---|---|---|---|
| Closed | $208,000 | ||
| Previous Owner | $269,100 |
We collect this data history from publicly available records. To have your information removed, we recommend requesting removal directly through your county’s website.
| Date | Event | Price | List to Sale | Price per Sq Ft |
|---|---|---|---|---|
| 01/21/2026 01/21/26 | For Sale | $385,000 | -- | $276 / Sq Ft |
We collect this data history from publicly available records. To have your information removed, we recommend requesting removal directly through your county’s website.
| Year | Tax Paid | Tax Assessment Tax Assessment Total Assessment is a certain percentage of the fair market value that is determined by local assessors to be the total taxable value of land and additions on the property. | Land | Improvement |
|---|---|---|---|---|
| 2025 | $1,545 | $14,299 | -- | -- |
| 2024 | $1,543 | $13,618 | -- | -- |
| 2023 | $1,543 | $24,170 | $4,830 | $19,340 |
| 2022 | $1,485 | $18,830 | $3,760 | $15,070 |
| 2021 | $1,499 | $18,160 | $3,630 | $14,530 |
| 2020 | $1,452 | $16,850 | $3,370 | $13,480 |
| 2019 | $1,425 | $14,470 | $2,890 | $11,580 |
| 2018 | $1,389 | $13,250 | $2,650 | $10,600 |
| 2017 | $1,343 | $11,380 | $2,270 | $9,110 |
| 2016 | $1,333 | $11,170 | $2,230 | $8,940 |
| 2015 | $1,250 | $10,480 | $2,090 | $8,390 |
Seller's Agent in 2026
Scott Vacek
Keller Williams Realty East Valley
(480) 779-7355
26 in this area
77 Total Sales
O
Seller Co-Listing Agent in 2026
Orit Vacek
Keller Williams Realty East Valley
(480) 839-6600
13 in this area
34 Total Sales
Ask me questions while you tour the home.