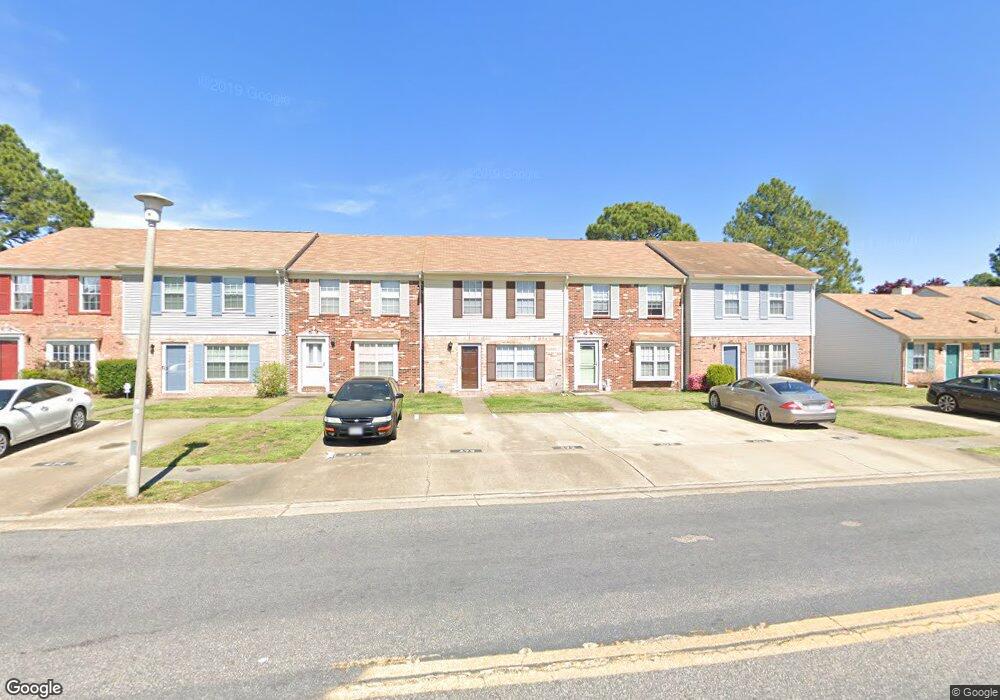
472 Hollomon Dr Hampton, VA 23666
Northampton NeighborhoodEstimated Value: $221,655 - $234,000
2
Beds
3
Baths
1,312
Sq Ft
$173/Sq Ft
Est. Value
About This Home
This home is located at 472 Hollomon Dr, Hampton, VA 23666 and is currently estimated at $226,664, approximately $172 per square foot. 472 Hollomon Dr is a home located in Hampton City with nearby schools including Christopher C. Kraft Elementary School, Cesar Tarrant Middle School, and Bethel High School.
Ownership History
Date
Name
Owned For
Owner Type
Purchase Details
Closed on
Sep 16, 2011
Sold by
Secretary Of Veterans Affairs
Bought by
Norris Howard E
Current Estimated Value
Purchase Details
Closed on
Sep 15, 2010
Sold by
Moore Sub Tr Cecil G and Esterberg Matthew T
Bought by
Secretary Of Veterans Affairs
Purchase Details
Closed on
May 31, 2006
Sold by
Jackson Reginald
Bought by
Esterberg Matthew T
Home Financials for this Owner
Home Financials are based on the most recent Mortgage that was taken out on this home.
Original Mortgage
$137,391
Interest Rate
6.62%
Mortgage Type
VA
Purchase Details
Closed on
Jun 28, 2001
Sold by
Hill Angelique J
Bought by
Jackson Reginald
Home Financials for this Owner
Home Financials are based on the most recent Mortgage that was taken out on this home.
Original Mortgage
$71,196
Interest Rate
7.14%
Create a Home Valuation Report for This Property
The Home Valuation Report is an in-depth analysis detailing your home's value as well as a comparison with similar homes in the area
Home Values in the Area
Average Home Value in this Area
Purchase History
| Date | Buyer | Sale Price | Title Company |
|---|---|---|---|
| Norris Howard E | $47,500 | -- | |
| Secretary Of Veterans Affairs | $118,976 | -- | |
| Esterberg Matthew T | $134,500 | -- | |
| Jackson Reginald | $69,800 | -- |
Source: Public Records
Mortgage History
| Date | Status | Borrower | Loan Amount |
|---|---|---|---|
| Previous Owner | Esterberg Matthew T | $137,391 | |
| Previous Owner | Jackson Reginald | $71,196 |
Source: Public Records
Tax History Compared to Growth
Tax History
| Year | Tax Paid | Tax Assessment Tax Assessment Total Assessment is a certain percentage of the fair market value that is determined by local assessors to be the total taxable value of land and additions on the property. | Land | Improvement |
|---|---|---|---|---|
| 2025 | $2,425 | $206,200 | $45,000 | $161,200 |
| 2024 | $2,203 | $191,600 | $45,000 | $146,600 |
| 2023 | $1,915 | $165,100 | $45,000 | $120,100 |
| 2022 | $1,849 | $156,700 | $38,000 | $118,700 |
| 2021 | $1,766 | $131,900 | $31,000 | $100,900 |
| 2020 | $1,570 | $126,600 | $31,000 | $95,600 |
| 2019 | $1,536 | $123,900 | $31,000 | $92,900 |
| 2018 | $1,629 | $123,800 | $30,600 | $93,200 |
| 2017 | $1,629 | $0 | $0 | $0 |
| 2016 | $1,629 | $123,800 | $0 | $0 |
| 2015 | $1,629 | $0 | $0 | $0 |
| 2014 | $1,693 | $123,800 | $30,600 | $93,200 |
Source: Public Records
Map
Nearby Homes
- 2919 Leta Ct
- 544 Hollomon Dr
- 2939 Threechopt Rd
- 88 Emeraude Plage Unit B
- 88 Emeraude Plage
- 27 Treasure Key
- 218 Albany Dr
- 3311 Candlewood Dr
- 3321 Candlewood Dr
- 512 Big Bethel Rd
- 515 Big Bethel Rd
- 3422 Candlewood Dr
- 612 Carlton Dr
- 4016 Threechopt Rd
- 30 Hickory Hill Rd
- 712 Macon Rd
- 4002 Candlewood Dr
- 111 Woodbury Forrest Dr
- 309 Sourwood Dr
- 4100 Candlewood Dr
- 474 Hollomon Dr
- 468 Hollomon Dr
- 476 Hollomon Dr
- 478 Hollomon Dr
- 464 Hollomon Dr
- 500 Hollomon Dr
- 462 Hollomon Dr
- 502 Hollomon Dr
- 460 Hollomon Dr
- 2901 Leta Ct
- 504 Hollomon Dr
- 458 Hollomon Dr
- 2903 Leta Ct
- 506 Hollomon Dr
- 456 Hollomon Dr
- 2900 Leta Ct
- 508 Hollomon Dr
- 2902 Leta Ct
- 2907 Leta Ct
- 510 Hollomon Dr