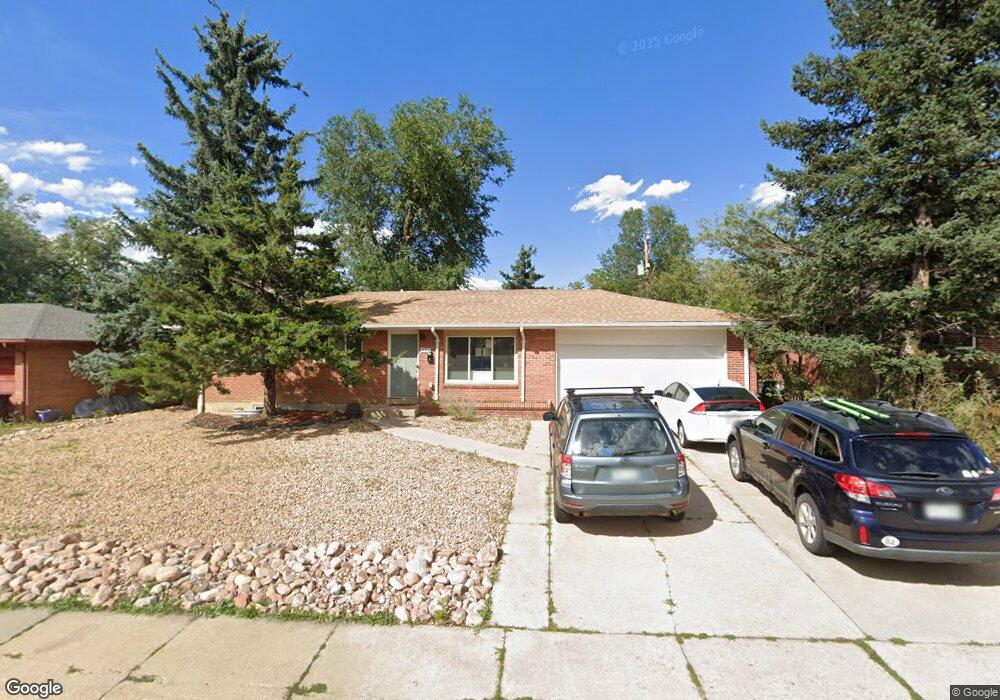
472 S Lashley Ln Boulder, CO 80305
South Boulder NeighborhoodEstimated Value: $769,429 - $981,000
4
Beds
2
Baths
1,026
Sq Ft
$822/Sq Ft
Est. Value
About This Home
This home is located at 472 S Lashley Ln, Boulder, CO 80305 and is currently estimated at $843,357, approximately $821 per square foot. 472 S Lashley Ln is a home located in Boulder County with nearby schools including Creekside Elementary School, Manhattan Middle School of the Arts & Academics, and Fairview High School.
Ownership History
Date
Name
Owned For
Owner Type
Purchase Details
Closed on
Apr 12, 2022
Sold by
Marcus Jennifer C
Bought by
Marcus Bolt Trust
Current Estimated Value
Purchase Details
Closed on
Oct 23, 2001
Sold by
Arpin Laurence A and Arpin Carole A
Bought by
Arpin Laurence A
Purchase Details
Closed on
May 15, 2000
Sold by
Rinard Debbie B
Bought by
Marcus Jennifer C
Home Financials for this Owner
Home Financials are based on the most recent Mortgage that was taken out on this home.
Original Mortgage
$261,100
Interest Rate
9.62%
Purchase Details
Closed on
Oct 15, 1998
Sold by
Rinard Eric A
Bought by
Rinard Debbie B
Purchase Details
Closed on
Feb 16, 1994
Sold by
Hullett Lawrence I and Hullett Carol J
Bought by
Arpin Laurence A
Home Financials for this Owner
Home Financials are based on the most recent Mortgage that was taken out on this home.
Original Mortgage
$131,000
Interest Rate
7.25%
Purchase Details
Closed on
Apr 22, 1992
Bought by
Marcus Jennifer C
Purchase Details
Closed on
Dec 30, 1986
Bought by
Marcus Jennifer C
Create a Home Valuation Report for This Property
The Home Valuation Report is an in-depth analysis detailing your home's value as well as a comparison with similar homes in the area
Home Values in the Area
Average Home Value in this Area
Purchase History
| Date | Buyer | Sale Price | Title Company |
|---|---|---|---|
| Marcus Bolt Trust | -- | None Listed On Document | |
| Arpin Laurence A | -- | -- | |
| Marcus Jennifer C | $274,900 | -- | |
| Rinard Debbie B | -- | -- | |
| Arpin Laurence A | $191,000 | -- | |
| Marcus Jennifer C | -- | -- | |
| Marcus Jennifer C | $79,000 | -- |
Source: Public Records
Mortgage History
| Date | Status | Borrower | Loan Amount |
|---|---|---|---|
| Previous Owner | Marcus Jennifer C | $261,100 | |
| Previous Owner | Arpin Laurence A | $131,000 |
Source: Public Records
Tax History
| Year | Tax Paid | Tax Assessment Tax Assessment Total Assessment is a certain percentage of the fair market value that is determined by local assessors to be the total taxable value of land and additions on the property. | Land | Improvement |
|---|---|---|---|---|
| 2025 | $4,289 | $48,462 | $30,731 | $17,731 |
| 2024 | $4,289 | $48,462 | $30,731 | $17,731 |
| 2023 | $4,215 | $48,803 | $36,482 | $16,006 |
| 2022 | $3,833 | $41,277 | $27,168 | $14,109 |
| 2021 | $3,655 | $42,464 | $27,949 | $14,515 |
| 2020 | $3,517 | $40,405 | $22,308 | $18,097 |
| 2019 | $3,463 | $40,405 | $22,308 | $18,097 |
| 2018 | $3,275 | $37,778 | $21,168 | $16,610 |
| 2017 | $3,173 | $41,766 | $23,402 | $18,364 |
| 2016 | $2,950 | $34,084 | $14,646 | $19,438 |
| 2015 | $2,794 | $27,780 | $12,656 | $15,124 |
| 2014 | $2,336 | $27,780 | $12,656 | $15,124 |
Source: Public Records
Map
Nearby Homes
- 345 S 38th St
- 3000 Dartmouth Ave
- 2955 Stanford Ave
- 3805 Martin Dr
- 210 S 39th St
- 450 S 41st St
- 2795 Vassar Dr
- 2585 Kohler Dr
- 2235 Vassar Dr
- 4453 Hamilton Ct
- 725 S 45th St
- 2860 Table Mesa Dr
- 4595 Moorhead Ave
- 4835 Moorhead Ave
- 4445 Squires Cir
- 4521 Navajo Place
- 2250 Bluebell Ave
- 4763 Tantra Dr Unit B
- 1965 Kohler Dr
- 800 W Moorhead Cir Unit E
- 464 S Lashley Ln
- 480 S Lashley Ln
- 3500 Fordham Ct
- 3490 Fordham Ct
- 3550 Fordham Ct
- 456 S Lashley Ln
- 488 S Lashley Ln
- 3470 Fordham Ct
- 345 S 36th St
- 448 S Lashley Ln
- 355 S 36th St
- 3590 Fordham Ct
- 3450 Fordham Ct
- 3555 Fordham Ct
- 3505 Fordham Ct
- 365 S 36th St
- 3495 Fordham Ct
- 440 S Lashley Ln
- 3390 Dover Dr
- 465 Harvard Ln
Your Personal Tour Guide
Ask me questions while you tour the home.