Estimated Value: $289,000 - $328,000
2
Beds
2
Baths
1,071
Sq Ft
$283/Sq Ft
Est. Value
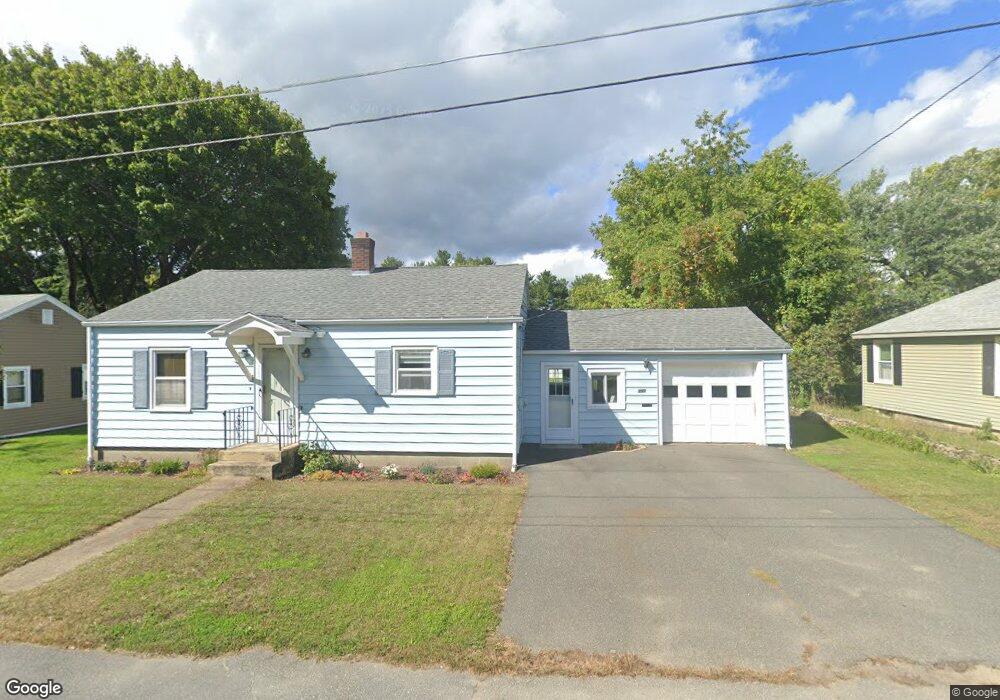
About This Home
This home is located at 472 Twichell St, Athol, MA 01331 and is currently estimated at $303,270, approximately $283 per square foot. 472 Twichell St is a home located in Worcester County with nearby schools including Athol High School.
Ownership History
Date
Name
Owned For
Owner Type
Purchase Details
Closed on
Jul 10, 2018
Sold by
Canning James A
Bought by
Smith Kim M
Current Estimated Value
Purchase Details
Closed on
Jan 19, 2001
Sold by
Leighton Joyce I
Bought by
Canning James A
Home Financials for this Owner
Home Financials are based on the most recent Mortgage that was taken out on this home.
Original Mortgage
$43,500
Interest Rate
7.52%
Mortgage Type
Purchase Money Mortgage
Purchase Details
Closed on
May 2, 1995
Sold by
Barrus Georgianna and Eileen Lindsey M
Bought by
Leighton Joyce
Create a Home Valuation Report for This Property
The Home Valuation Report is an in-depth analysis detailing your home's value as well as a comparison with similar homes in the area
Home Values in the Area
Average Home Value in this Area
Purchase History
| Date | Buyer | Sale Price | Title Company |
|---|---|---|---|
| Smith Kim M | -- | -- | |
| Canning James A | $82,500 | -- | |
| Leighton Joyce | $67,500 | -- |
Source: Public Records
Mortgage History
| Date | Status | Borrower | Loan Amount |
|---|---|---|---|
| Previous Owner | Leighton Joyce | $43,500 |
Source: Public Records
Tax History
| Year | Tax Paid | Tax Assessment Tax Assessment Total Assessment is a certain percentage of the fair market value that is determined by local assessors to be the total taxable value of land and additions on the property. | Land | Improvement |
|---|---|---|---|---|
| 2025 | $3,058 | $240,600 | $54,800 | $185,800 |
| 2024 | $2,960 | $230,700 | $54,800 | $175,900 |
| 2023 | $2,776 | $197,700 | $39,800 | $157,900 |
| 2022 | $2,602 | $162,100 | $37,900 | $124,200 |
| 2021 | $2,506 | $141,900 | $34,400 | $107,500 |
| 2020 | $2,336 | $136,000 | $31,300 | $104,700 |
| 2019 | $2,227 | $127,600 | $29,500 | $98,100 |
| 2018 | $2,217 | $113,300 | $26,800 | $86,500 |
| 2017 | $2,036 | $99,800 | $26,800 | $73,000 |
| 2016 | $1,884 | $95,000 | $26,800 | $68,200 |
| 2015 | $1,808 | $95,000 | $26,800 | $68,200 |
| 2014 | $1,751 | $95,000 | $26,800 | $68,200 |
Source: Public Records
Map
Nearby Homes
- 31 Locke Ave
- 87 Bellevue Dr E
- 225 Wallingford Ave
- 15 Wilson Ave
- 38 Twichell St
- 65 Lakeview Ave
- 0 W Royalston Rd
- 660 Pinedale Ave
- 77 Old Keene Rd
- 330 N Orange Rd
- 31 Freedom St
- 22 Allen St
- 42 Prospect St
- 128 Allen St
- 503 School St
- 160 Cottage St
- 1179 Main St
- 0 Adams Dr
- 193 Freedom St
- 70 Mount Pleasant St