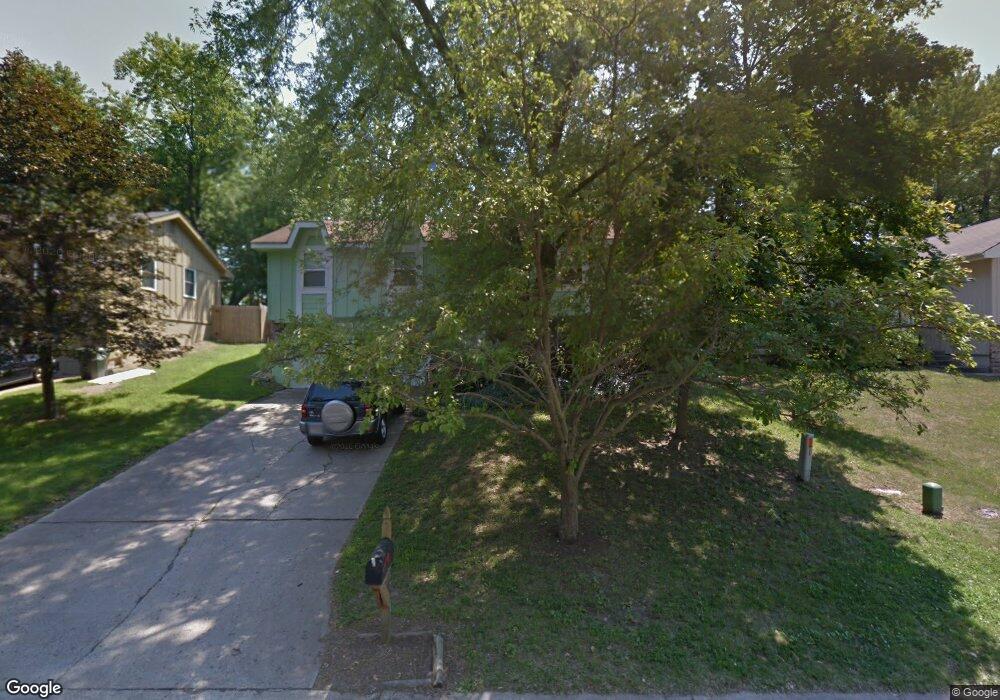
4720 N Fisk Ave Kansas City, MO 64151
Estimated Value: $198,000 - $281,057
4
Beds
2
Baths
1,044
Sq Ft
$237/Sq Ft
Est. Value
About This Home
This home is located at 4720 N Fisk Ave, Kansas City, MO 64151 and is currently estimated at $247,514, approximately $237 per square foot. 4720 N Fisk Ave is a home located in Platte County with nearby schools including English Landing Elementary School, Lakeview Middle School, and Plaza Middle School.
Ownership History
Date
Name
Owned For
Owner Type
Purchase Details
Closed on
Sep 15, 2020
Sold by
Schillig Bryan and Schillig Paige
Bought by
Schillig Bryan A and Schillig Paige L
Current Estimated Value
Home Financials for this Owner
Home Financials are based on the most recent Mortgage that was taken out on this home.
Original Mortgage
$94,700
Outstanding Balance
$66,833
Interest Rate
2.4%
Mortgage Type
New Conventional
Estimated Equity
$180,681
Purchase Details
Closed on
Jun 4, 2015
Sold by
Schillig Bryan A and Schillig Paige
Bought by
Schillig Bryan A
Purchase Details
Closed on
Nov 22, 2011
Sold by
Fannie Mae
Bought by
Schillig Bryan A
Home Financials for this Owner
Home Financials are based on the most recent Mortgage that was taken out on this home.
Original Mortgage
$79,927
Interest Rate
4.15%
Mortgage Type
FHA
Create a Home Valuation Report for This Property
The Home Valuation Report is an in-depth analysis detailing your home's value as well as a comparison with similar homes in the area
Home Values in the Area
Average Home Value in this Area
Purchase History
| Date | Buyer | Sale Price | Title Company |
|---|---|---|---|
| Schillig Bryan A | -- | Accommodation | |
| Schillig Bryan | -- | Platinum Title Llc | |
| Schillig Bryan A | -- | None Available | |
| Schillig Bryan A | -- | None Available |
Source: Public Records
Mortgage History
| Date | Status | Borrower | Loan Amount |
|---|---|---|---|
| Open | Schillig Bryan | $94,700 | |
| Closed | Schillig Bryan A | $79,927 |
Source: Public Records
Tax History Compared to Growth
Tax History
| Year | Tax Paid | Tax Assessment Tax Assessment Total Assessment is a certain percentage of the fair market value that is determined by local assessors to be the total taxable value of land and additions on the property. | Land | Improvement |
|---|---|---|---|---|
| 2024 | $2,364 | $31,693 | $6,243 | $25,450 |
| 2023 | $2,364 | $31,693 | $6,243 | $25,450 |
| 2022 | $2,121 | $28,072 | $6,243 | $21,829 |
| 2021 | $2,128 | $28,072 | $6,243 | $21,829 |
| 2020 | $1,927 | $24,909 | $2,201 | $22,708 |
| 2019 | $1,927 | $24,909 | $2,201 | $22,708 |
| 2018 | $1,173 | $14,945 | $3,040 | $11,905 |
| 2017 | $1,167 | $14,945 | $3,040 | $11,905 |
| 2016 | $1,187 | $14,945 | $3,040 | $11,905 |
| 2015 | $1,192 | $14,945 | $3,040 | $11,905 |
| 2013 | $1,074 | $13,863 | $0 | $0 |
Source: Public Records
Map
Nearby Homes
- 4717 NW Fisk Ave
- 4803 NW Woody Creek Ln
- 6456 NW 49th St
- 4937 NW Woody Creek Ln
- 6700 NW 50th St
- 6108 NW 49th Terrace
- 6108 NW 51st Terrace
- 5114 Montebella Dr
- 4890 NW Honker Ct
- 5122 NW 47 Terrace
- 4871 NW Vicolo Dellamore Way
- 5110 Montebella Dr
- 4867 NW Vicolo Dellamore Way
- 5146 NW 47 Terrace
- 4864 NW Vicolo Dellamore Way
- 5154 NW 47 Terrace
- 5155 NW 47 Terrace
- 5158 NW 47 Terrace
- 5171 NW 47 Terrace
- The York Plan at Montebella
- 4720 NW Fisk Ave
- 4718 N Fisk Ave
- 4718 NW Fisk Ave
- 4722 N Fisk Ave
- 4716 N Fisk Ave
- 4724 N Fisk Ave
- 4719 NW Fisk
- 4726 N Fisk Ave
- 4714 N Fisk Ave
- 4721 NW Fisk Ave
- 4721 N Fisk Ave
- 4719 NW Fisk Ave
- 4723 N Fisk Ave
- 4717 N Fisk Ave
- 4725 NW Fisk Ave
- 4725 N Fisk Ave
- 4712 N Fisk Ave
- 6203 Wall St
- 4728 N Fisk Ave
- 4715 N Fisk Ave