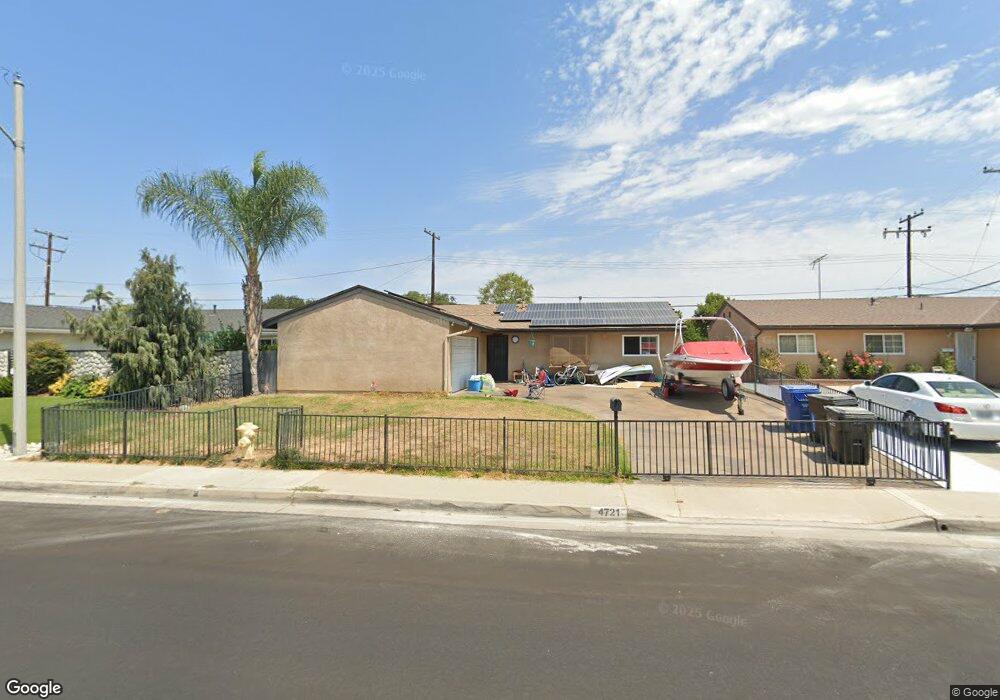
4721 Myra Ave Cypress, CA 90630
Estimated Value: $996,000 - $1,122,000
4
Beds
2
Baths
1,723
Sq Ft
$610/Sq Ft
Est. Value
About This Home
This home is located at 4721 Myra Ave, Cypress, CA 90630 and is currently estimated at $1,051,507, approximately $610 per square foot. 4721 Myra Ave is a home located in Orange County with nearby schools including Margaret Landell Elementary School, A.E. Arnold Elementary School, and Lexington Junior High School.
Ownership History
Date
Name
Owned For
Owner Type
Purchase Details
Closed on
Jan 25, 2011
Sold by
Groover Joseph William and Groover Shanon Kaleen
Bought by
Groover Joseph William and Groover Shanon Kaleen
Current Estimated Value
Home Financials for this Owner
Home Financials are based on the most recent Mortgage that was taken out on this home.
Original Mortgage
$355,000
Outstanding Balance
$239,800
Interest Rate
4.82%
Mortgage Type
New Conventional
Estimated Equity
$811,707
Purchase Details
Closed on
Jul 3, 2003
Sold by
Pollard Desmond L
Bought by
Groover Joseph William and Groover Shannon Kaleen
Home Financials for this Owner
Home Financials are based on the most recent Mortgage that was taken out on this home.
Original Mortgage
$296,000
Interest Rate
5.29%
Mortgage Type
Purchase Money Mortgage
Create a Home Valuation Report for This Property
The Home Valuation Report is an in-depth analysis detailing your home's value as well as a comparison with similar homes in the area
Home Values in the Area
Average Home Value in this Area
Purchase History
| Date | Buyer | Sale Price | Title Company |
|---|---|---|---|
| Groover Joseph William | -- | First American Title Company | |
| Groover Joseph William | $370,000 | Commonwealth Land Title |
Source: Public Records
Mortgage History
| Date | Status | Borrower | Loan Amount |
|---|---|---|---|
| Open | Groover Joseph William | $355,000 | |
| Previous Owner | Groover Joseph William | $296,000 | |
| Closed | Groover Joseph William | $37,000 |
Source: Public Records
Tax History
| Year | Tax Paid | Tax Assessment Tax Assessment Total Assessment is a certain percentage of the fair market value that is determined by local assessors to be the total taxable value of land and additions on the property. | Land | Improvement |
|---|---|---|---|---|
| 2025 | $6,911 | $619,526 | $452,380 | $167,146 |
| 2024 | $6,911 | $607,379 | $443,510 | $163,869 |
| 2023 | $6,753 | $595,470 | $434,814 | $160,656 |
| 2022 | $6,674 | $583,795 | $426,289 | $157,506 |
| 2021 | $6,586 | $572,349 | $417,931 | $154,418 |
| 2020 | $6,560 | $566,481 | $413,646 | $152,835 |
| 2019 | $6,373 | $555,374 | $405,535 | $149,839 |
| 2018 | $6,287 | $544,485 | $397,584 | $146,901 |
| 2017 | $6,069 | $533,809 | $389,788 | $144,021 |
| 2016 | $5,668 | $491,480 | $382,145 | $109,335 |
| 2015 | $5,626 | $484,098 | $376,405 | $107,693 |
| 2014 | $5,326 | $474,616 | $369,032 | $105,584 |
Source: Public Records
Map
Nearby Homes
- 4811 Myra Ave
- 4611 Myra Ave
- 10292 Ethel St
- 4691 Cathy Ave
- 4385 Larwin Ave
- 4449 Avenida Granada
- 5068 Cumberland Dr
- 4305 Larwin Ave
- 4183 Elizabeth Ct
- 4238 Via Largo
- 4790 Montefino Dr
- 9598 Naples Dr
- 10202 Aqueduct Dr
- 4194 Paseo de Oro
- 10403 Stratton Ct
- 5353 Cumberland Dr
- 9432 Alderbury St
- 10144 Bloomfield Ave
- 10411 Saint Alban St
- 5482 Myra Ave
- 4741 Myra Ave
- 4711 Myra Ave
- 4751 Myra Ave
- 4701 Myra Ave
- 10152 Julie Beth St
- 10151 Julie Beth St
- 4761 Myra Ave
- 10151 Ethel St
- 10162 Julie Beth St
- 4738 Larwin Ave
- 4718 Larwin Ave
- 4681 Myra Ave
- 4736 Larwin Ave
- 4716 Larwin Ave
- 10161 Julie Beth St
- 4771 Myra Ave
- 10161 Ethel St
- 4734 Larwin Ave
- 10152 Janice Lynn St
- 4758 Larwin Ave
Your Personal Tour Guide
Ask me questions while you tour the home.