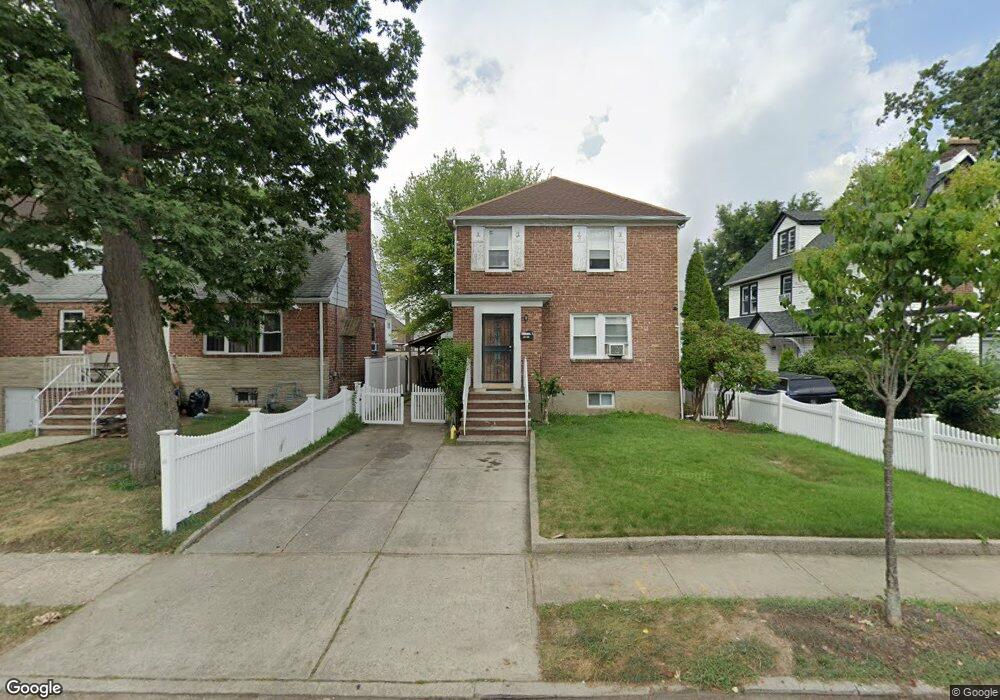
4722 163rd St Flushing, NY 11358
East Flushing NeighborhoodEstimated Value: $1,001,107 - $1,120,000
Studio
--
Bath
1,288
Sq Ft
$832/Sq Ft
Est. Value
About This Home
This home is located at 4722 163rd St, Flushing, NY 11358 and is currently estimated at $1,071,527, approximately $831 per square foot. 4722 163rd St is a home located in Queens County with nearby schools including P.S. 107 Thomas A Dooley, Rachel Carson I.S. 237Q, and Francis Lewis High School.
Ownership History
Date
Name
Owned For
Owner Type
Purchase Details
Closed on
Dec 10, 2008
Sold by
Choi Kyung Yeol
Bought by
Tan Jacqueline Yaci
Current Estimated Value
Home Financials for this Owner
Home Financials are based on the most recent Mortgage that was taken out on this home.
Original Mortgage
$300,000
Outstanding Balance
$196,987
Interest Rate
6.17%
Mortgage Type
Purchase Money Mortgage
Estimated Equity
$874,540
Purchase Details
Closed on
Dec 4, 2003
Sold by
Dai He-Jun and Liu John Zheng
Bought by
Choi Kyung Yeol
Home Financials for this Owner
Home Financials are based on the most recent Mortgage that was taken out on this home.
Original Mortgage
$322,000
Interest Rate
5.65%
Mortgage Type
Purchase Money Mortgage
Create a Home Valuation Report for This Property
The Home Valuation Report is an in-depth analysis detailing your home's value as well as a comparison with similar homes in the area
Home Values in the Area
Average Home Value in this Area
Purchase History
| Date | Buyer | Sale Price | Title Company |
|---|---|---|---|
| Tan Jacqueline Yaci | $575,000 | -- | |
| Tan Jacqueline Yaci | $575,000 | -- | |
| Choi Kyung Yeol | $505,000 | -- | |
| Choi Kyung Yeol | $505,000 | -- |
Source: Public Records
Mortgage History
| Date | Status | Borrower | Loan Amount |
|---|---|---|---|
| Open | Tan Jacqueline Yaci | $300,000 | |
| Closed | Tan Jacqueline Yaci | $300,000 | |
| Previous Owner | Choi Kyung Yeol | $322,000 | |
| Closed | Choi Kyung Yeol | $56,000 |
Source: Public Records
Tax History
| Year | Tax Paid | Tax Assessment Tax Assessment Total Assessment is a certain percentage of the fair market value that is determined by local assessors to be the total taxable value of land and additions on the property. | Land | Improvement |
|---|---|---|---|---|
| 2025 | $8,916 | $47,052 | $16,145 | $30,907 |
| 2024 | $8,916 | $44,389 | $18,254 | $26,135 |
| 2023 | $8,916 | $44,389 | $15,502 | $28,887 |
| 2022 | $8,739 | $56,880 | $18,900 | $37,980 |
| 2021 | $8,691 | $58,620 | $18,900 | $39,720 |
| 2020 | $8,300 | $57,120 | $18,900 | $38,220 |
| 2019 | $7,738 | $57,240 | $18,900 | $38,340 |
| 2018 | $7,541 | $36,991 | $13,393 | $23,598 |
| 2017 | $7,436 | $36,480 | $14,082 | $22,398 |
| 2016 | $6,880 | $36,480 | $14,082 | $22,398 |
| 2015 | $4,151 | $32,675 | $15,187 | $17,488 |
| 2014 | $4,151 | $30,826 | $15,960 | $14,866 |
Source: Public Records
Map
Nearby Homes
- 47-21 162nd St
- 47-23 164th St
- 46-12 161st St Unit 1D
- 46-12 161st St Unit 2C
- 47-04 167th St
- 157-51 Rose Ave
- 45-74 164th St
- 157-18 Laburnum Ave
- 4920 167th St
- 49-54 166th St
- 46-05 158th St
- 45-57 160th St
- 47-09 156th St
- 16475 Underhill Ave
- 164-75 Underhill Ave
- 4940 169th St
- 148-29 Laburnum Ave
- 163-02 45th Ave
- 148-24 Kalmia Ave
- 45-19 158th St
- 4718 163rd St
- 4726 163rd St
- 4726 163rd St
- 47-26 163rd St
- 4718 163rd St
- 47-30 163rd St
- 4716 163rd St
- 4730 163rd St Unit 2
- 4730 163rd St
- 4730 163rd St
- 4721 162nd St
- 4712 163rd St
- 4729 162nd St
- 4715 162nd St
- 4736 163rd St
- 4710 163rd St
- 47-15 162nd St
- 4715 162nd St
- 4715 162nd St Unit 2nd FL
- 4715 162nd St Unit 1st FL
Your Personal Tour Guide
Ask me questions while you tour the home.