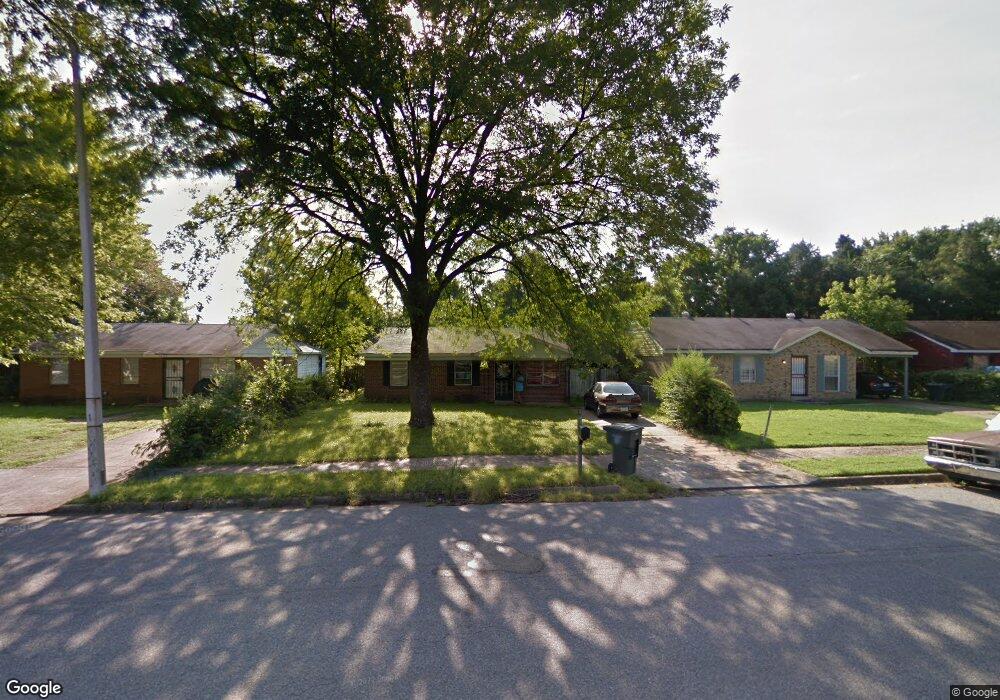
4722 Royal Ridge Dr Memphis, TN 38128
Frayser NeighborhoodEstimated Value: $99,000 - $135,000
3
Beds
1
Bath
948
Sq Ft
$119/Sq Ft
Est. Value
About This Home
This home is located at 4722 Royal Ridge Dr, Memphis, TN 38128 and is currently estimated at $112,667, approximately $118 per square foot. 4722 Royal Ridge Dr is a home located in Shelby County with nearby schools including Egypt Elementary School, Raleigh Egypt High School, and Promise Academy - Spring Hill.
Ownership History
Date
Name
Owned For
Owner Type
Purchase Details
Closed on
Sep 30, 2021
Sold by
C & J Property Llc
Bought by
4 Starr Management Group Inc
Current Estimated Value
Home Financials for this Owner
Home Financials are based on the most recent Mortgage that was taken out on this home.
Original Mortgage
$216,300
Outstanding Balance
$197,245
Interest Rate
2.8%
Mortgage Type
Commercial
Estimated Equity
-$84,578
Purchase Details
Closed on
Mar 13, 2008
Sold by
Pickett Greg
Bought by
Sanchez Joseph N and Sanchez Annette L
Purchase Details
Closed on
Nov 16, 2004
Sold by
Federal National Mortgage Association
Bought by
Pickett Greg
Purchase Details
Closed on
Jul 30, 2004
Sold by
Alston Larry T and Alston Barbara A
Bought by
Federal National Mortgage Association
Purchase Details
Closed on
Feb 11, 1998
Sold by
Alston Mary
Bought by
Alston Larry T and Alston Barbara
Purchase Details
Closed on
Oct 4, 1997
Sold by
Adams Angela
Bought by
Alston Mary
Create a Home Valuation Report for This Property
The Home Valuation Report is an in-depth analysis detailing your home's value as well as a comparison with similar homes in the area
Home Values in the Area
Average Home Value in this Area
Purchase History
| Date | Buyer | Sale Price | Title Company |
|---|---|---|---|
| 4 Starr Management Group Inc | $132,000 | None Available | |
| Sanchez Joseph N | $33,000 | Realty Title & Escrow Co Inc | |
| Pickett Greg | $22,000 | West Tn Title Ins Agency | |
| Federal National Mortgage Association | $47,565 | -- | |
| Alston Larry T | -- | -- | |
| Alston Mary | $3,100 | -- |
Source: Public Records
Mortgage History
| Date | Status | Borrower | Loan Amount |
|---|---|---|---|
| Open | 4 Starr Management Group Inc | $216,300 |
Source: Public Records
Tax History Compared to Growth
Tax History
| Year | Tax Paid | Tax Assessment Tax Assessment Total Assessment is a certain percentage of the fair market value that is determined by local assessors to be the total taxable value of land and additions on the property. | Land | Improvement |
|---|---|---|---|---|
| 2025 | $470 | $19,050 | $2,250 | $16,800 |
| 2024 | $470 | $13,850 | $1,975 | $11,875 |
| 2023 | $844 | $13,850 | $1,975 | $11,875 |
| 2022 | $844 | $13,850 | $1,975 | $11,875 |
| 2021 | $1,003 | $13,850 | $1,975 | $11,875 |
| 2020 | $688 | $9,500 | $1,975 | $7,525 |
| 2019 | $304 | $9,500 | $1,975 | $7,525 |
| 2018 | $304 | $9,500 | $1,975 | $7,525 |
| 2017 | $311 | $9,500 | $1,975 | $7,525 |
| 2016 | $425 | $9,725 | $0 | $0 |
| 2014 | $425 | $9,725 | $0 | $0 |
Source: Public Records
Map
Nearby Homes
- 3726 Royal Wood Dr
- 4768 Royal Ridge Dr
- 4757 Bluff Wood Cove
- 3621 Royal Wood Dr
- 4657 Christyshire Dr
- 4709 Old Raleigh Millington Rd
- 4036 Hinge Gate Ln
- 4062 Hinge Gate Ln
- 4050 Hinge Gate Ln
- 4479 Raleigh Millington Rd
- 3704 Ridgemont Ave
- 3360 Red Cliff Cove
- 3614 Trudy Cove
- 4378 Shadcrest Rd
- 4250 Trudy St
- 2807 Epping Crest Cove
- 2831 Epping Crest Cove
- 2823 Epping Crest Cove
- 2815 Epping Crest Cove
- 4627 Crystal Springs Dr
- 4716 Royal Ridge Dr
- 4728 Royal Ridge Dr
- 4712 Royal Ridge Dr
- 3759 Bluff Wood Dr
- 4706 Royal Ridge Dr
- 3744 Royal Wood Dr
- 3745 Bluff Wood Dr
- 4700 Royal Ridge Dr
- 4705 Royal Ridge Dr
- 3738 Royal Wood Dr
- 3737 Bluff Wood Dr
- 3760 Bluff Wood Dr
- 4694 Royal Ridge Dr
- 3737 Royal Wood Dr
- 3732 Royal Wood Dr
- 3733 Bluff Wood Dr
- 4697 Royal Ridge Dr
- 3744 Bluff Wood Dr
- 3733 Royal Wood Dr
- 4690 Royal Ridge Dr