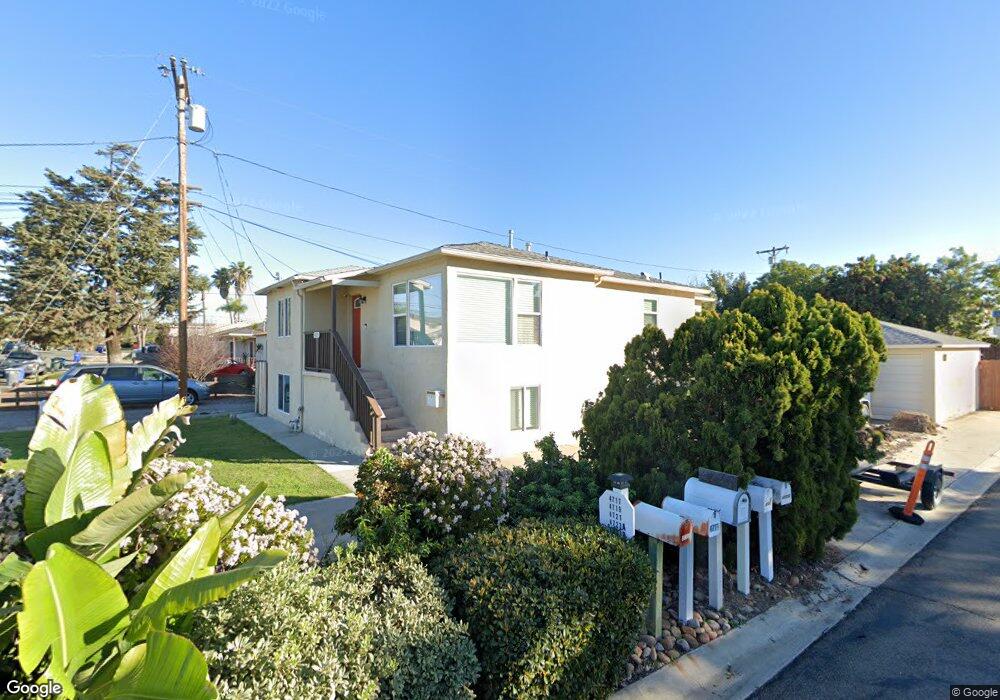
4725 68th St La Mesa, CA 91942
Estimated Value: $862,000 - $944,000
4
Beds
3
Baths
1,614
Sq Ft
$554/Sq Ft
Est. Value
About This Home
This home is located at 4725 68th St, La Mesa, CA 91942 and is currently estimated at $893,485, approximately $553 per square foot. 4725 68th St is a home located in San Diego County with nearby schools including Rolando Elementary School, La Mesa Arts Academy, and Mount Miguel High School.
Ownership History
Date
Name
Owned For
Owner Type
Purchase Details
Closed on
Jul 5, 2018
Sold by
Oftedal Troy Elif
Bought by
Lawrence Robert W
Current Estimated Value
Home Financials for this Owner
Home Financials are based on the most recent Mortgage that was taken out on this home.
Original Mortgage
$518,400
Outstanding Balance
$450,264
Interest Rate
4.6%
Mortgage Type
New Conventional
Estimated Equity
$443,221
Purchase Details
Closed on
Jun 11, 2014
Sold by
Broc Assets Inc
Bought by
Oftedal Troy Leif
Purchase Details
Closed on
Apr 3, 2014
Sold by
Broc Global Inc
Bought by
Broc Assbts Inc
Purchase Details
Closed on
Sep 18, 2012
Sold by
Fannie Mae
Bought by
Broc Global Inc
Purchase Details
Closed on
Mar 8, 2012
Sold by
James B Nutter & Company
Bought by
Fannie Mae
Purchase Details
Closed on
Feb 29, 2012
Sold by
Huehl Vivian
Bought by
James B Nutter & Company
Purchase Details
Closed on
Feb 6, 1987
Bought by
Huehl Vivian
Create a Home Valuation Report for This Property
The Home Valuation Report is an in-depth analysis detailing your home's value as well as a comparison with similar homes in the area
Purchase History
| Date | Buyer | Sale Price | Title Company |
|---|---|---|---|
| Lawrence Robert W | $576,000 | Fidelity National Title | |
| Oftedal Troy Leif | $447,000 | California Title Company | |
| Broc Assbts Inc | -- | None Available | |
| Broc Global Inc | $206,000 | Commerce Title | |
| Fannie Mae | -- | First American Title Insuran | |
| James B Nutter & Company | $255,000 | First American Title Ins Co | |
| Huehl Vivian | $115,500 | -- |
Source: Public Records
Mortgage History
| Date | Status | Borrower | Loan Amount |
|---|---|---|---|
| Open | Lawrence Robert W | $518,400 |
Source: Public Records
Tax History
| Year | Tax Paid | Tax Assessment Tax Assessment Total Assessment is a certain percentage of the fair market value that is determined by local assessors to be the total taxable value of land and additions on the property. | Land | Improvement |
|---|---|---|---|---|
| 2025 | $8,051 | $642,534 | $316,235 | $326,299 |
| 2024 | $8,051 | $629,936 | $310,035 | $319,901 |
| 2023 | $7,816 | $617,585 | $303,956 | $313,629 |
| 2022 | $7,700 | $605,477 | $297,997 | $307,480 |
| 2021 | $7,554 | $593,605 | $292,154 | $301,451 |
| 2020 | $7,280 | $587,519 | $289,159 | $298,360 |
| 2019 | $7,154 | $576,000 | $283,490 | $292,510 |
| 2018 | $5,977 | $472,149 | $232,378 | $239,771 |
| 2017 | $50 | $462,892 | $227,822 | $235,070 |
| 2016 | $5,648 | $453,816 | $223,355 | $230,461 |
| 2015 | $5,597 | $447,000 | $220,000 | $227,000 |
| 2014 | $2,943 | $226,934 | $170,771 | $56,163 |
Source: Public Records
Map
Nearby Homes
- 6850 Rosefield Dr
- 4557 Toni Ln
- 6969 Tower St
- 4844 68th St Unit 3
- 4790 70th St Unit 6
- 6927 Amherst St Unit 3
- 6927 Amherst St Unit 1
- 4623 Alamo Dr
- 4796 Valencia Dr
- 6979-81 Amherst St
- 4635 Mataro Dr
- 7105 Amherst St
- 4445 Mataro Dr
- 4350 68th St
- 7118 Stanford Ave
- 4775 Seminole Dr Unit 201
- 6650 Vigo Dr
- 4777 Seminole Dr Unit 118
- 4860 Rolando Ct Unit 52
- 4860 Rolando Ct Unit 81
- 4729 68th St
- 4715 68th St
- 4717 68th St
- 4735 68th St
- 6821 Century St
- 4719 68th St
- 4723 68th St
- 4723 68th St Unit A
- 4718 68th St Unit 20
- 4741 68th St
- 6844 Tower St Unit 46
- 4722 68th St
- 6820 Tower St
- 6830 Tower St
- 4734 68th St Unit 36
- 4718/4720 68th
- 4721 68th St
- 6810 Tower St
- 6830-36 Tower St
- 6829 Century St
Your Personal Tour Guide
Ask me questions while you tour the home.