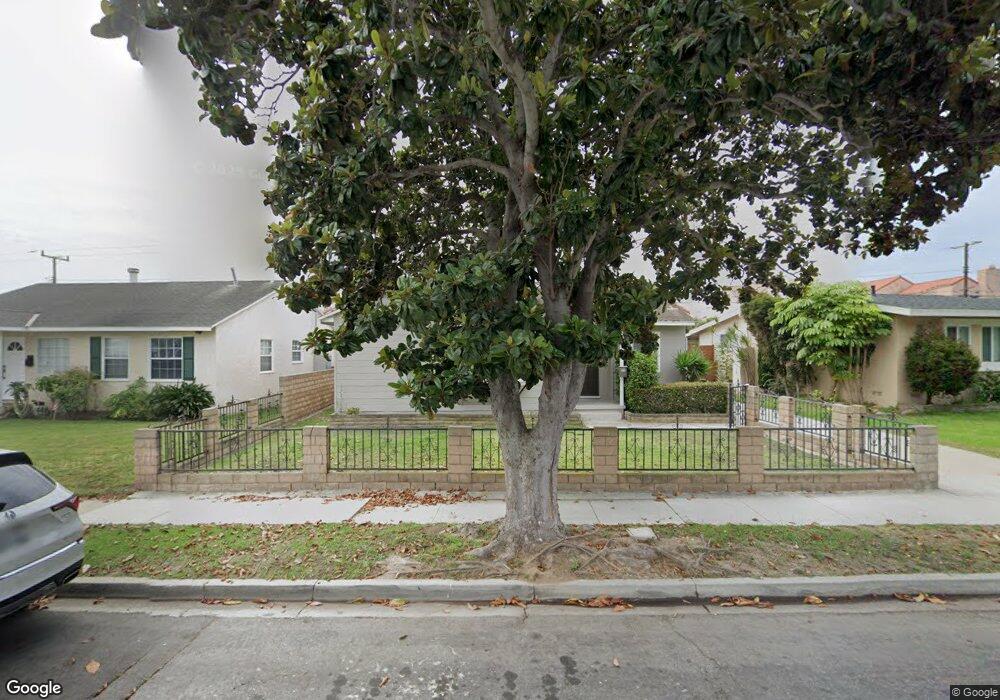
4726 Narrot St Torrance, CA 90503
West Torrance NeighborhoodEstimated Value: $1,239,000 - $1,464,000
3
Beds
2
Baths
1,577
Sq Ft
$872/Sq Ft
Est. Value
About This Home
This home is located at 4726 Narrot St, Torrance, CA 90503 and is currently estimated at $1,375,023, approximately $871 per square foot. 4726 Narrot St is a home located in Los Angeles County with nearby schools including Towers Elementary School, Bert M. Lynn Middle School, and West High School.
Ownership History
Date
Name
Owned For
Owner Type
Purchase Details
Closed on
Jan 9, 2020
Sold by
Ho K S K and Ho Nancy Yu Ping
Bought by
Ho Stanley Yao Wen and Kao Anna C
Current Estimated Value
Purchase Details
Closed on
Jan 26, 2015
Sold by
Ho Nancy Yu Ping
Bought by
Ho Nancy Yu Ping and Ho Stanley Yao Wen
Purchase Details
Closed on
Sep 2, 2014
Sold by
Ho Nancy Yu Ping
Bought by
Ho Nancy Yu Ping and Ho Stanley Yao Wen
Purchase Details
Closed on
Jul 18, 1997
Sold by
Derflinger Masha K
Bought by
Ho Nancy Yu Ping and Ho Stanley Yao Wen
Home Financials for this Owner
Home Financials are based on the most recent Mortgage that was taken out on this home.
Original Mortgage
$178,520
Outstanding Balance
$25,288
Interest Rate
7.37%
Estimated Equity
$1,349,735
Purchase Details
Closed on
Jun 30, 1997
Sold by
Ho Kuang Sen
Bought by
Ho Nancy Yu Ping
Home Financials for this Owner
Home Financials are based on the most recent Mortgage that was taken out on this home.
Original Mortgage
$178,520
Outstanding Balance
$25,288
Interest Rate
7.37%
Estimated Equity
$1,349,735
Create a Home Valuation Report for This Property
The Home Valuation Report is an in-depth analysis detailing your home's value as well as a comparison with similar homes in the area
Home Values in the Area
Average Home Value in this Area
Purchase History
| Date | Buyer | Sale Price | Title Company |
|---|---|---|---|
| Ho Stanley Yao Wen | -- | None Available | |
| Ho Nancy Yu Ping | -- | None Available | |
| Ho Nancy Yu Ping | -- | None Available | |
| Ho Nancy Yu Ping | $255,000 | Fidelity National Title | |
| Ho Nancy Yu Ping | -- | -- |
Source: Public Records
Mortgage History
| Date | Status | Borrower | Loan Amount |
|---|---|---|---|
| Open | Ho Nancy Yu Ping | $178,520 |
Source: Public Records
Tax History Compared to Growth
Tax History
| Year | Tax Paid | Tax Assessment Tax Assessment Total Assessment is a certain percentage of the fair market value that is determined by local assessors to be the total taxable value of land and additions on the property. | Land | Improvement |
|---|---|---|---|---|
| 2025 | $4,850 | $407,146 | $325,726 | $81,420 |
| 2024 | $4,850 | $399,164 | $319,340 | $79,824 |
| 2023 | $4,765 | $391,338 | $313,079 | $78,259 |
| 2022 | $4,702 | $383,666 | $306,941 | $76,725 |
| 2021 | $4,611 | $376,144 | $300,923 | $75,221 |
| 2019 | $4,481 | $364,990 | $291,999 | $72,991 |
| 2018 | $4,315 | $357,834 | $286,274 | $71,560 |
| 2016 | $4,116 | $343,940 | $275,158 | $68,782 |
| 2015 | $4,028 | $338,774 | $271,025 | $67,749 |
| 2014 | $3,930 | $332,138 | $265,716 | $66,422 |
Source: Public Records
Map
Nearby Homes
- 4819 Halison St
- 20017 Bernist Ave
- 19219 Beckworth Ave
- 20034 Grevillea Ave
- 2905 Spreckels Ct
- 19509 Hinsdale Ave
- 2600 Alvord Ln
- 2617 Alvord Ln
- 18801 Hawthorne Blvd Unit 19
- 18801 Hawthorne Blvd Unit 59
- 4549 186th St
- 2345 W 190th St Unit 77
- 2345 190th St Unit 42
- 2345 190th St Unit 24
- 2708 184th St
- 5305 Wilma St
- 2708 183rd St
- 907 Lilienthal Ln
- 18406 Kingsdale Ave
- 4489 Spencer St Unit 224