S
Seller's Agent in 2018
Scott Leader
My Home Group
(310) 721-8187
8 Total Sales
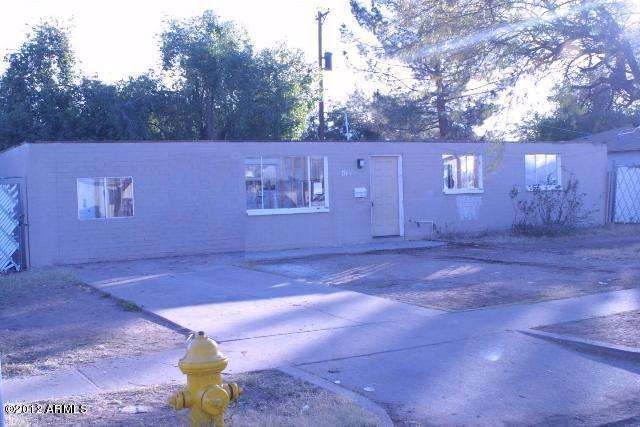
Property was recently damaged in a fire and requires significant repair. Great investment opportunity. Traditional sale.
Last Agent to Sell the Property
Integrity All Stars License #BR100814000 Listed on: 03/26/2012
| Date | Type | Sale Price | Title Company |
|---|---|---|---|
| Warranty Deed | $200,000 | Lawyers Title Of Arizona Inc | |
| Warranty Deed | -- | Lawyers Title Of Arizona Inc | |
| Interfamily Deed Transfer | -- | Equity Title Agency Inc | |
| Warranty Deed | $98,000 | Equity Title Agency Inc | |
| Cash Sale Deed | $84,000 | Fidelity National Title Co | |
| Cash Sale Deed | $33,500 | Fidelity National Title Agen | |
| Quit Claim Deed | -- | None Available | |
| Cash Sale Deed | $10,100 | Great American Title Agency | |
| Trustee Deed | $24,000 | None Available | |
| Interfamily Deed Transfer | -- | First American Title Ins Co | |
| Warranty Deed | $92,500 | Capital Title Agency Inc | |
| Interfamily Deed Transfer | -- | Grand Canyon Title Agency In | |
| Warranty Deed | $81,000 | Grand Canyon Title Agency In | |
| Interfamily Deed Transfer | -- | -- |
| Date | Status | Loan Amount | Loan Type |
|---|---|---|---|
| Open | $294,261 | FHA | |
| Closed | $284,086 | FHA | |
| Closed | $198,718 | FHA | |
| Closed | $197,544 | FHA | |
| Closed | $196,377 | FHA | |
| Previous Owner | $78,400 | New Conventional | |
| Previous Owner | $114,000 | Purchase Money Mortgage | |
| Previous Owner | $91,070 | FHA |
| Date | Event | Price | Change | Sq Ft Price |
|---|---|---|---|---|
| 04/24/2018 04/24/18 | Sold | $200,000 | -2.4% | $119 / Sq Ft |
| 04/24/2018 04/24/18 | For Sale | $205,000 | 0.0% | $122 / Sq Ft |
| 04/24/2018 04/24/18 | Price Changed | $205,000 | 0.0% | $122 / Sq Ft |
| 04/20/2018 04/20/18 | For Sale | $205,000 | 0.0% | $122 / Sq Ft |
| 04/20/2018 04/20/18 | Price Changed | $205,000 | 0.0% | $122 / Sq Ft |
| 03/30/2018 03/30/18 | Pending | -- | -- | -- |
| 03/29/2018 03/29/18 | For Sale | $205,000 | 0.0% | $122 / Sq Ft |
| 11/21/2015 11/21/15 | Rented | $950 | 0.0% | -- |
| 11/20/2015 11/20/15 | Under Contract | -- | -- | -- |
| 11/04/2015 11/04/15 | For Rent | $950 | +6.1% | -- |
| 07/25/2015 07/25/15 | Rented | $895 | 0.0% | -- |
| 07/10/2015 07/10/15 | Off Market | $895 | -- | -- |
| 07/06/2015 07/06/15 | For Rent | $895 | 0.0% | -- |
| 12/19/2014 12/19/14 | Sold | $98,000 | -2.0% | $58 / Sq Ft |
| 11/09/2014 11/09/14 | Price Changed | $100,000 | -9.1% | $60 / Sq Ft |
| 11/06/2014 11/06/14 | For Sale | $110,000 | 0.0% | $65 / Sq Ft |
| 08/02/2014 08/02/14 | Rented | $1,000 | 0.0% | -- |
| 07/15/2014 07/15/14 | Under Contract | -- | -- | -- |
| 07/01/2014 07/01/14 | For Rent | $1,000 | 0.0% | -- |
| 06/14/2013 06/14/13 | Rented | $1,000 | -98.8% | -- |
| 06/03/2013 06/03/13 | Under Contract | -- | -- | -- |
| 04/24/2013 04/24/13 | Sold | $84,000 | 0.0% | $50 / Sq Ft |
| 04/24/2013 04/24/13 | For Rent | $1,200 | 0.0% | -- |
| 04/12/2013 04/12/13 | Pending | -- | -- | -- |
| 04/09/2013 04/09/13 | For Sale | $90,000 | 0.0% | $54 / Sq Ft |
| 03/16/2013 03/16/13 | Pending | -- | -- | -- |
| 03/11/2013 03/11/13 | Price Changed | $90,000 | -4.3% | $54 / Sq Ft |
| 02/26/2013 02/26/13 | Price Changed | $94,000 | -1.1% | $56 / Sq Ft |
| 12/14/2012 12/14/12 | Price Changed | $95,000 | -1.0% | $57 / Sq Ft |
| 12/04/2012 12/04/12 | For Sale | $96,000 | 0.0% | $57 / Sq Ft |
| 11/13/2012 11/13/12 | Pending | -- | -- | -- |
| 11/09/2012 11/09/12 | For Sale | $96,000 | 0.0% | $57 / Sq Ft |
| 11/06/2012 11/06/12 | Pending | -- | -- | -- |
| 10/31/2012 10/31/12 | For Sale | $96,000 | +186.6% | $57 / Sq Ft |
| 05/01/2012 05/01/12 | Sold | $33,500 | -6.9% | $25 / Sq Ft |
| 05/01/2012 05/01/12 | For Sale | $36,000 | 0.0% | $27 / Sq Ft |
| 05/01/2012 05/01/12 | Price Changed | $36,000 | 0.0% | $27 / Sq Ft |
| 04/17/2012 04/17/12 | Price Changed | $36,000 | -14.3% | $27 / Sq Ft |
| 03/26/2012 03/26/12 | For Sale | $42,000 | -- | $32 / Sq Ft |
| Year | Tax Paid | Tax Assessment Tax Assessment Total Assessment is a certain percentage of the fair market value that is determined by local assessors to be the total taxable value of land and additions on the property. | Land | Improvement |
|---|---|---|---|---|
| 2025 | $1,247 | $8,043 | -- | -- |
| 2024 | $1,279 | $7,660 | -- | -- |
| 2023 | $1,279 | $23,150 | $4,630 | $18,520 |
| 2022 | $1,201 | $17,750 | $3,550 | $14,200 |
| 2021 | $1,226 | $15,350 | $3,070 | $12,280 |
| 2020 | $1,157 | $13,780 | $2,750 | $11,030 |
| 2019 | $1,104 | $11,670 | $2,330 | $9,340 |
| 2018 | $1,154 | $10,710 | $2,140 | $8,570 |
| 2017 | $1,219 | $8,700 | $1,740 | $6,960 |
| 2016 | $1,165 | $7,670 | $1,530 | $6,140 |
| 2015 | $1,087 | $6,330 | $1,260 | $5,070 |
S
Seller's Agent in 2018
Scott Leader
My Home Group
(310) 721-8187
8 Total Sales

Buyer's Agent in 2018
Viviana Luera
HomeSmart
(623) 670-1809
1 in this area
66 Total Sales
E
Seller's Agent in 2015
Erich Sielaff
West USA Realty
M
Buyer's Agent in 2015
Moira Huss
Arizona Premier Realty Homes & Land, LLC
B
Seller's Agent in 2014
Brandon Mullan
Coldwell Banker Realty
Seller's Agent in 2013
Joseph Girmonde
eXp Realty
(480) 734-5094
44 Total Sales
Source: Arizona Regional Multiple Listing Service (ARMLS)
MLS Number: 4734997
APN: 107-46-016
Disclaimer: Certain information contained herein is derived from information provided by parties other than Homes.com. All information provided is deemed reliable, but is not guaranteed to be accurate and should be independently verified.
![]() All information should be verified by the recipient and none is guaranteed as accurate by ARMLS
All information should be verified by the recipient and none is guaranteed as accurate by ARMLS
Listing Information presented by local MLS brokerage: Ten-X, local REALTOR®- Arlene Richardson - (888)-952-6393