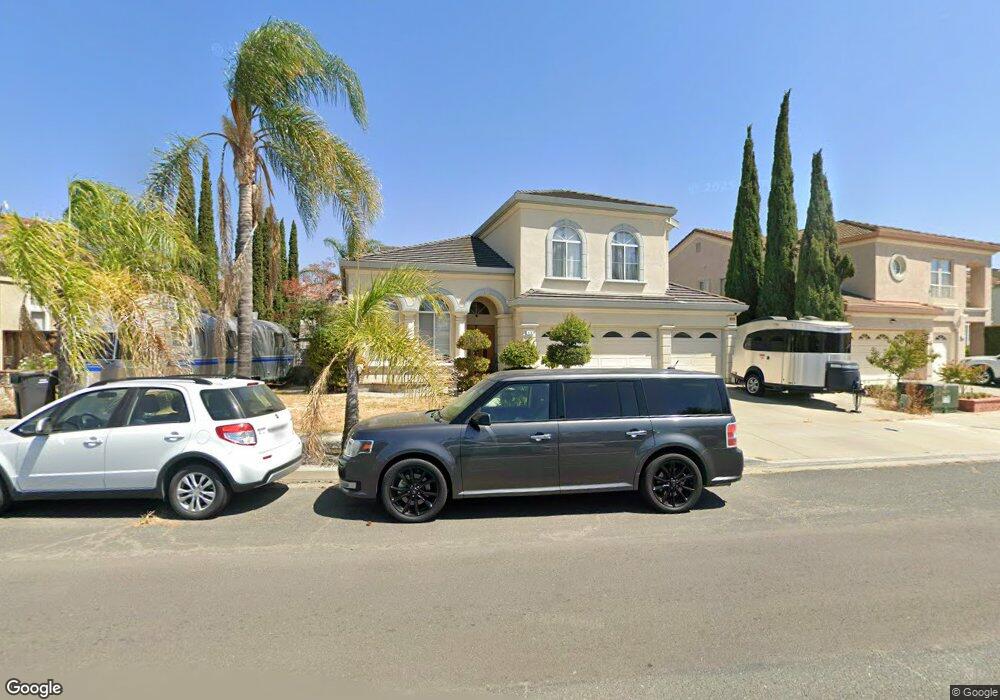
473 Paseo Refugio Milpitas, CA 95035
Estimated Value: $1,653,000 - $2,617,000
4
Beds
3
Baths
2,913
Sq Ft
$768/Sq Ft
Est. Value
About This Home
This home is located at 473 Paseo Refugio, Milpitas, CA 95035 and is currently estimated at $2,235,926, approximately $767 per square foot. 473 Paseo Refugio is a home located in Santa Clara County with nearby schools including Curtner Elementary School, Thomas Russell Middle School, and Milpitas High School.
Ownership History
Date
Name
Owned For
Owner Type
Purchase Details
Closed on
Jul 30, 2025
Sold by
Onalfo Angelo Joseph and Onalfo Nguyet Tammy
Bought by
Onalfo Family Living Trust and Onalfo
Current Estimated Value
Purchase Details
Closed on
Aug 29, 2020
Sold by
Pham Chi Kim and Onalfo Angelo J
Bought by
Chi Kim Pham Revocable Living Trust and Pham
Home Financials for this Owner
Home Financials are based on the most recent Mortgage that was taken out on this home.
Original Mortgage
$680,000
Interest Rate
2.9%
Mortgage Type
New Conventional
Purchase Details
Closed on
May 11, 2020
Sold by
Onalfo Angelo J and Onalfo Nguyet T
Bought by
Onalfo Angelo J and Onalfo Nguyet T
Home Financials for this Owner
Home Financials are based on the most recent Mortgage that was taken out on this home.
Original Mortgage
$678,000
Interest Rate
3.3%
Mortgage Type
New Conventional
Purchase Details
Closed on
Nov 3, 2017
Sold by
Pham Chi Kim and Onalfo Angelo J
Bought by
Pham Chi Kim and The Chi Kim Pham Revocable Liv
Home Financials for this Owner
Home Financials are based on the most recent Mortgage that was taken out on this home.
Original Mortgage
$700,000
Interest Rate
3.83%
Mortgage Type
New Conventional
Purchase Details
Closed on
Aug 12, 2014
Sold by
Pham Chi Kim and Onalfo Angelo J
Bought by
Pham Chi Kim
Home Financials for this Owner
Home Financials are based on the most recent Mortgage that was taken out on this home.
Original Mortgage
$575,000
Interest Rate
4.12%
Mortgage Type
New Conventional
Purchase Details
Closed on
Aug 24, 2009
Sold by
Pham Chi Kim
Bought by
Pham Chi Kim
Purchase Details
Closed on
Sep 19, 2005
Sold by
Pham Chi Kim
Bought by
Pham Chi Kim and Onalfo Nguyet Tammy
Home Financials for this Owner
Home Financials are based on the most recent Mortgage that was taken out on this home.
Original Mortgage
$600,000
Interest Rate
6%
Mortgage Type
Purchase Money Mortgage
Purchase Details
Closed on
Oct 8, 2002
Sold by
Pham Chi Kim
Bought by
Pham Chi Kim
Purchase Details
Closed on
May 17, 2001
Sold by
Le Cong Thanh
Bought by
Pham Kim Chi
Purchase Details
Closed on
Nov 28, 1995
Sold by
Shapell Industries Inc
Bought by
Le Cong Thanh and Pham Kim Chi
Home Financials for this Owner
Home Financials are based on the most recent Mortgage that was taken out on this home.
Original Mortgage
$150,000
Interest Rate
7.42%
Create a Home Valuation Report for This Property
The Home Valuation Report is an in-depth analysis detailing your home's value as well as a comparison with similar homes in the area
Home Values in the Area
Average Home Value in this Area
Purchase History
| Date | Buyer | Sale Price | Title Company |
|---|---|---|---|
| Onalfo Family Living Trust | -- | None Listed On Document | |
| Chi Kim Pham Revocable Living Trust | -- | Old Republic Title | |
| Pham Chi Kim | -- | Old Republic Title | |
| Onalfo Angelo J | -- | Old Republic Title Company | |
| Pham Chi Kim | -- | Old Republic Title Company | |
| Pham Chi Kim | -- | First American Title Company | |
| Pham Chi Kim | -- | First American Title Company | |
| Pham Chi Kim | -- | Accommodation | |
| Pham Chi Kim | -- | Chicago Title Company | |
| Pham Chi Kim | -- | None Available | |
| Pham Chi Kim | $300,000 | Alliance Title Company | |
| Pham Chi Kim | -- | -- | |
| Pham Kim Chi | $300,500 | -- | |
| Le Cong Thanh | $438,000 | First American Title Guarant |
Source: Public Records
Mortgage History
| Date | Status | Borrower | Loan Amount |
|---|---|---|---|
| Previous Owner | Pham Chi Kim | $680,000 | |
| Previous Owner | Pham Chi Kim | $678,000 | |
| Previous Owner | Pham Chi Kim | $700,000 | |
| Previous Owner | Pham Chi Kim | $575,000 | |
| Previous Owner | Pham Chi Kim | $600,000 | |
| Previous Owner | Le Cong Thanh | $150,000 |
Source: Public Records
Tax History
| Year | Tax Paid | Tax Assessment Tax Assessment Total Assessment is a certain percentage of the fair market value that is determined by local assessors to be the total taxable value of land and additions on the property. | Land | Improvement |
|---|---|---|---|---|
| 2025 | $11,710 | $1,021,110 | $422,341 | $598,769 |
| 2024 | $11,710 | $1,001,089 | $414,060 | $587,029 |
| 2023 | $11,674 | $981,461 | $405,942 | $575,519 |
| 2022 | $11,626 | $962,218 | $397,983 | $564,235 |
| 2021 | $11,458 | $943,352 | $390,180 | $553,172 |
| 2020 | $11,259 | $933,680 | $386,180 | $547,500 |
| 2019 | $11,130 | $915,373 | $378,608 | $536,765 |
| 2018 | $10,568 | $897,426 | $371,185 | $526,241 |
| 2017 | $10,432 | $879,830 | $363,907 | $515,923 |
| 2016 | $10,012 | $862,579 | $356,772 | $505,807 |
| 2015 | $9,911 | $849,623 | $351,413 | $498,210 |
| 2014 | $9,651 | $832,981 | $344,530 | $488,451 |
Source: Public Records
Map
Nearby Homes
- 7280 Marylinn Dr
- 0 Railroad Ave
- 102 Marylinn Dr
- 685 Parvin Dr
- 170 Marylinn Dr
- 60 Jacklin Place
- 137 Caladenia Ln
- 1000 Jacklin Rd
- 207 Redwood Ave
- 808 Cameron Cir
- 1006 N Abbott Ave
- 1008 N Abbott Ave
- 50 Serra Way
- 513 Glenmoor Cir
- 527 Maple Ave
- 1200 N Abbott Ave Unit 200
- 472 Glenmoor Cir
- 551 Chestnut Ave
- 1087 N Abbott Ave
- 1103 Creed St
- 465 Paseo Refugio
- 481 Paseo Refugio
- 476 Loch Lomond Ct
- 457 Paseo Refugio
- 489 Paseo Refugio
- 486 Loch Lomond Ct
- 466 Loch Lomond Ct
- 361 Paseo Refugio
- 496 Loch Lomond Ct
- 497 Paseo Refugio
- 456 Loch Lomond Ct
- 470 Dundee Ave
- 369 Paseo Refugio
- 506 Loch Lomond Ct
- 505 Paseo Refugio
- 377 Paseo Refugio
- 446 Loch Lomond Ct
- 495 Loch Lomond Ct
- 485 Loch Lomond Ct
- 385 Paseo Refugio
Your Personal Tour Guide
Ask me questions while you tour the home.