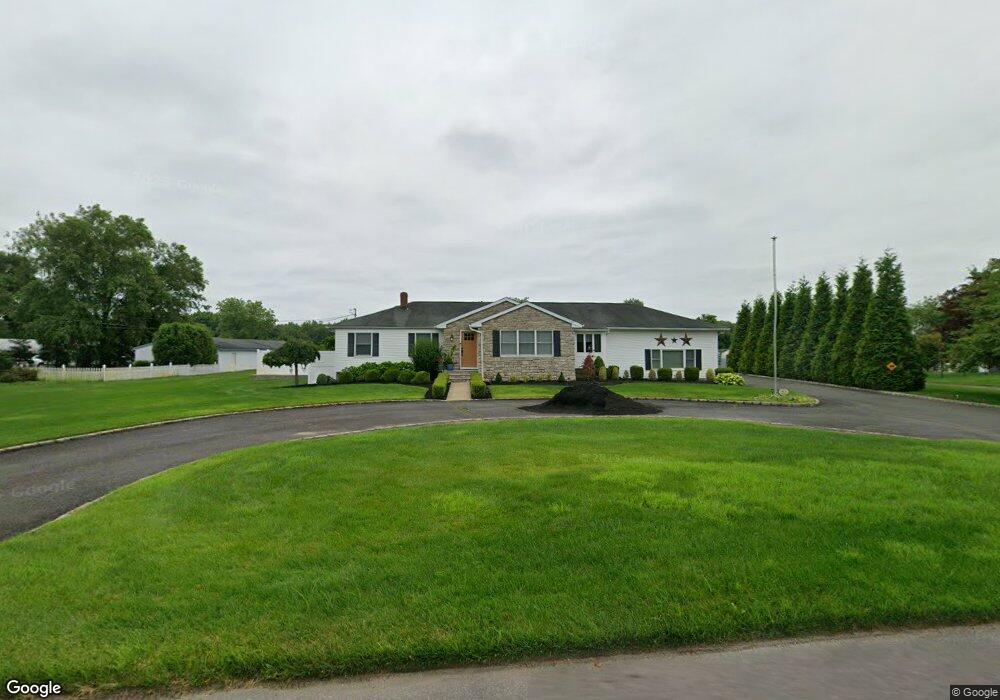
473 Squankum Yellowbrook Rd Farmingdale, NJ 07727
Adelphia NeighborhoodEstimated Value: $735,000 - $869,000
4
Beds
2
Baths
2,704
Sq Ft
$304/Sq Ft
Est. Value
About This Home
This home is located at 473 Squankum Yellowbrook Rd, Farmingdale, NJ 07727 and is currently estimated at $821,043, approximately $303 per square foot. 473 Squankum Yellowbrook Rd is a home located in Monmouth County with nearby schools including Ardena School, Adelphia Elementary School, and Howell Middle School North.
Ownership History
Date
Name
Owned For
Owner Type
Purchase Details
Closed on
Feb 20, 2019
Sold by
Martino Thomas C
Bought by
Martino Thomas C and Martino Elizabeth A
Current Estimated Value
Purchase Details
Closed on
Apr 13, 2012
Sold by
Martino Thomas C and Martino Robin D
Bought by
Martino Thomas C
Home Financials for this Owner
Home Financials are based on the most recent Mortgage that was taken out on this home.
Original Mortgage
$255,000
Outstanding Balance
$169,431
Interest Rate
3.12%
Mortgage Type
New Conventional
Estimated Equity
$651,612
Create a Home Valuation Report for This Property
The Home Valuation Report is an in-depth analysis detailing your home's value as well as a comparison with similar homes in the area
Home Values in the Area
Average Home Value in this Area
Purchase History
| Date | Buyer | Sale Price | Title Company |
|---|---|---|---|
| Martino Thomas C | -- | None Available | |
| Martino Thomas C | $118,323 | None Available |
Source: Public Records
Mortgage History
| Date | Status | Borrower | Loan Amount |
|---|---|---|---|
| Open | Martino Thomas C | $255,000 |
Source: Public Records
Tax History Compared to Growth
Tax History
| Year | Tax Paid | Tax Assessment Tax Assessment Total Assessment is a certain percentage of the fair market value that is determined by local assessors to be the total taxable value of land and additions on the property. | Land | Improvement |
|---|---|---|---|---|
| 2025 | $10,854 | $618,700 | $229,000 | $389,700 |
| 2024 | $10,379 | $611,500 | $229,000 | $382,500 |
| 2023 | $10,379 | $557,400 | $183,800 | $373,600 |
| 2022 | $10,940 | $500,600 | $120,500 | $380,100 |
| 2021 | $10,940 | $478,600 | $140,500 | $338,100 |
| 2020 | $11,039 | $474,800 | $140,500 | $334,300 |
| 2019 | $10,893 | $459,600 | $131,000 | $328,600 |
| 2018 | $10,388 | $436,300 | $123,000 | $313,300 |
| 2017 | $10,159 | $421,700 | $118,000 | $303,700 |
| 2016 | $10,108 | $414,100 | $118,000 | $296,100 |
| 2015 | $10,018 | $406,400 | $118,000 | $288,400 |
| 2014 | $10,479 | $394,400 | $126,000 | $268,400 |
Source: Public Records
Map
Nearby Homes
- 483 Squankum Yellowbrook Rd
- 467 Squankum Yellowbrook Rd
- 00 Squankum Yellowbrook Rd
- 102 Southard Ave
- 108 Southard Ave
- 111 Squankum Yellowbrook Rd
- 118 Southard Ave
- 500 Squankum Yellowbrook Rd
- 120 Southard Ave
- 434 Squankum Yellowbrook Rd
- 511 Squankum Yellowbrook Rd
- 515 Squankum Yellowbrook Rd
- 29 Natures Dr
- 30 Natures Dr
- 418 Squankum Yellowbrook Rd
- 2 Geraldine Ct
- 28 Natures Dr
- 412 Squankum Yellowbrook Rd
- 5 Geraldine Ct
- 1 Geraldine Ct