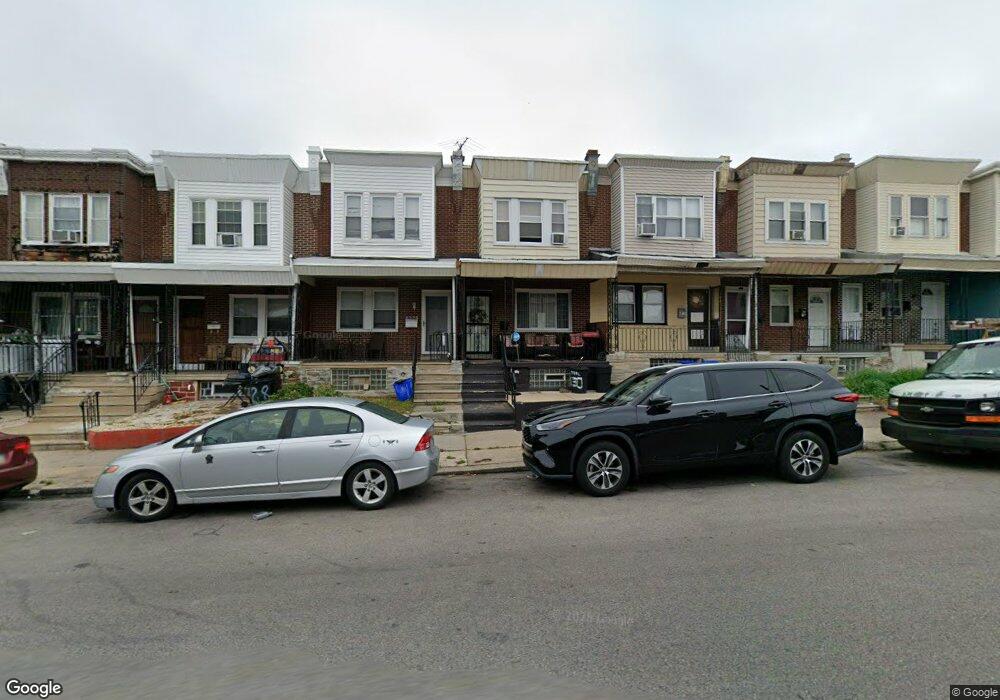
4730 C St Philadelphia, PA 19120
Feltonville NeighborhoodEstimated Value: $158,000 - $193,000
3
Beds
1
Bath
1,200
Sq Ft
$142/Sq Ft
Est. Value
About This Home
This home is located at 4730 C St, Philadelphia, PA 19120 and is currently estimated at $170,862, approximately $142 per square foot. 4730 C St is a home located in Philadelphia County with nearby schools including Barton School, Feltonville Intermediate School, and Feltonville School of Arts & Sciences.
Ownership History
Date
Name
Owned For
Owner Type
Purchase Details
Closed on
May 22, 2001
Sold by
Londono Fernando
Bought by
Marshall Maurice
Current Estimated Value
Home Financials for this Owner
Home Financials are based on the most recent Mortgage that was taken out on this home.
Original Mortgage
$42,900
Outstanding Balance
$16,043
Interest Rate
7.05%
Mortgage Type
FHA
Estimated Equity
$154,819
Purchase Details
Closed on
Dec 16, 1994
Sold by
Quitter Catherine E and Quitter Nicholas J
Bought by
Londono Fernando
Create a Home Valuation Report for This Property
The Home Valuation Report is an in-depth analysis detailing your home's value as well as a comparison with similar homes in the area
Home Values in the Area
Average Home Value in this Area
Purchase History
| Date | Buyer | Sale Price | Title Company |
|---|---|---|---|
| Marshall Maurice | $42,900 | -- | |
| Londono Fernando | $34,000 | -- |
Source: Public Records
Mortgage History
| Date | Status | Borrower | Loan Amount |
|---|---|---|---|
| Open | Marshall Maurice | $42,900 |
Source: Public Records
Tax History Compared to Growth
Tax History
| Year | Tax Paid | Tax Assessment Tax Assessment Total Assessment is a certain percentage of the fair market value that is determined by local assessors to be the total taxable value of land and additions on the property. | Land | Improvement |
|---|---|---|---|---|
| 2025 | $1,516 | $139,200 | $27,840 | $111,360 |
| 2024 | $1,516 | $139,200 | $27,840 | $111,360 |
| 2023 | $1,516 | $108,300 | $21,660 | $86,640 |
| 2022 | $809 | $108,300 | $21,660 | $86,640 |
| 2021 | $809 | $0 | $0 | $0 |
| 2020 | $809 | $0 | $0 | $0 |
| 2019 | $1,058 | $0 | $0 | $0 |
| 2018 | $1,043 | $0 | $0 | $0 |
| 2017 | $1,043 | $0 | $0 | $0 |
| 2016 | $1,043 | $0 | $0 | $0 |
| 2015 | $998 | $0 | $0 | $0 |
| 2014 | -- | $74,500 | $6,653 | $67,847 |
| 2012 | -- | $8,896 | $1,311 | $7,585 |
Source: Public Records
Map
Nearby Homes