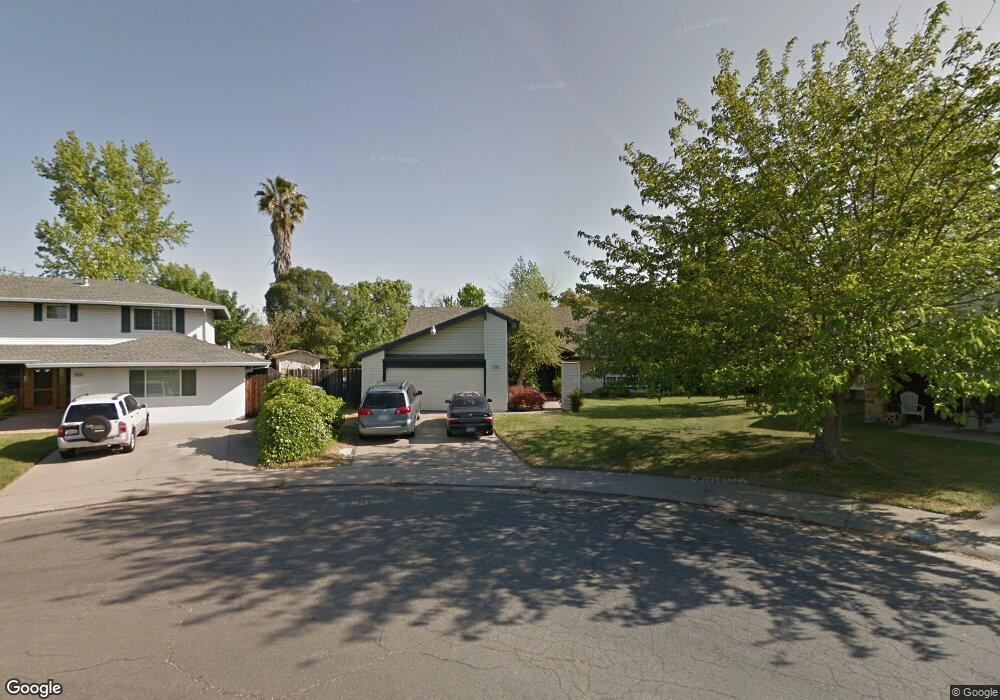
4732 Selkirk Way Fair Oaks, CA 95628
Estimated Value: $512,000 - $580,934
4
Beds
2
Baths
1,559
Sq Ft
$346/Sq Ft
Est. Value
About This Home
This home is located at 4732 Selkirk Way, Fair Oaks, CA 95628 and is currently estimated at $539,484, approximately $346 per square foot. 4732 Selkirk Way is a home located in Sacramento County with nearby schools including Thomas Kelly Elementary School, John Barrett Middle School, and Del Campo High School.
Ownership History
Date
Name
Owned For
Owner Type
Purchase Details
Closed on
May 1, 2024
Sold by
Tenney James A and Tenney Margaret Ellen
Bought by
James And Margaret Tenney Family Trust and Tenney
Current Estimated Value
Purchase Details
Closed on
Feb 9, 2000
Sold by
Northridge West Townhomes Lp
Bought by
Shaw Vee Kong and Foo Siew Onn
Home Financials for this Owner
Home Financials are based on the most recent Mortgage that was taken out on this home.
Original Mortgage
$546,000
Interest Rate
8.06%
Purchase Details
Closed on
Feb 23, 1995
Sold by
Zorichak Joseph S and Zorichak Marjorie V
Bought by
Tenney James A and Tenney Margaret Ellen
Home Financials for this Owner
Home Financials are based on the most recent Mortgage that was taken out on this home.
Original Mortgage
$145,860
Interest Rate
9.09%
Mortgage Type
Assumption
Create a Home Valuation Report for This Property
The Home Valuation Report is an in-depth analysis detailing your home's value as well as a comparison with similar homes in the area
Home Values in the Area
Average Home Value in this Area
Purchase History
| Date | Buyer | Sale Price | Title Company |
|---|---|---|---|
| James And Margaret Tenney Family Trust | -- | None Listed On Document | |
| Shaw Vee Kong | $776,500 | Fidelity National Title Co | |
| Tenney James A | $143,000 | North American Title Company |
Source: Public Records
Mortgage History
| Date | Status | Borrower | Loan Amount |
|---|---|---|---|
| Previous Owner | Shaw Vee Kong | $546,000 | |
| Previous Owner | Tenney James A | $145,860 |
Source: Public Records
Tax History
| Year | Tax Paid | Tax Assessment Tax Assessment Total Assessment is a certain percentage of the fair market value that is determined by local assessors to be the total taxable value of land and additions on the property. | Land | Improvement |
|---|---|---|---|---|
| 2025 | $2,875 | $248,913 | $121,428 | $127,485 |
| 2024 | $2,875 | $244,034 | $119,048 | $124,986 |
| 2023 | $2,828 | $239,250 | $116,714 | $122,536 |
| 2022 | $2,770 | $234,560 | $114,426 | $120,134 |
| 2021 | $2,722 | $229,962 | $112,183 | $117,779 |
| 2020 | $2,671 | $227,605 | $111,033 | $116,572 |
| 2019 | $2,521 | $215,300 | $108,856 | $106,444 |
| 2018 | $2,491 | $211,079 | $106,722 | $104,357 |
| 2017 | $2,465 | $206,941 | $104,630 | $102,311 |
| 2016 | $2,301 | $202,884 | $102,579 | $100,305 |
| 2015 | $2,305 | $199,838 | $101,039 | $98,799 |
| 2014 | $2,257 | $195,924 | $99,060 | $96,864 |
Source: Public Records
Map
Nearby Homes
- 6817 Mount Vernon Way
- 6824 Will Rogers Dr
- 7131 Sunset Ave
- 6919 Los Olivos Way
- 4434 Mapel Ln
- 4664 Ladera Way
- 6410 Rolling Way
- 5164 Patti Jo Dr
- 6395 Perrin Way
- 6319 Saint James Dr
- 4243 Glenridge Dr
- 4204 Abraham Way
- 7400 Heather Rd
- 6901 Lincoln Creek Cir
- 4907 Crestview Dr
- 4463 San Juan Ave
- 5262 Flagstone St
- 4300 Donnybrook Way
- 4124 Mindt Ct
- 4823 Schuyler Dr
- 4728 Selkirk Way
- 4734 Papaya Dr
- 4736 Selkirk Way
- 4738 Papaya Dr
- 4730 Papaya Dr
- 4742 Papaya Dr
- 4709 Orono Ct
- 4713 Orono Ct
- 4740 Selkirk Way
- 4724 Selkirk Way
- 4726 Papaya Dr
- 4739 Selkirk Way
- 4746 Papaya Dr
- 4705 Orono Ct
- 4744 Selkirk Way
- 4720 Selkirk Way
- 4743 Selkirk Way
- 4737 Papaya Dr
- 4741 Papaya Dr
- 4733 Papaya Dr
Your Personal Tour Guide
Ask me questions while you tour the home.