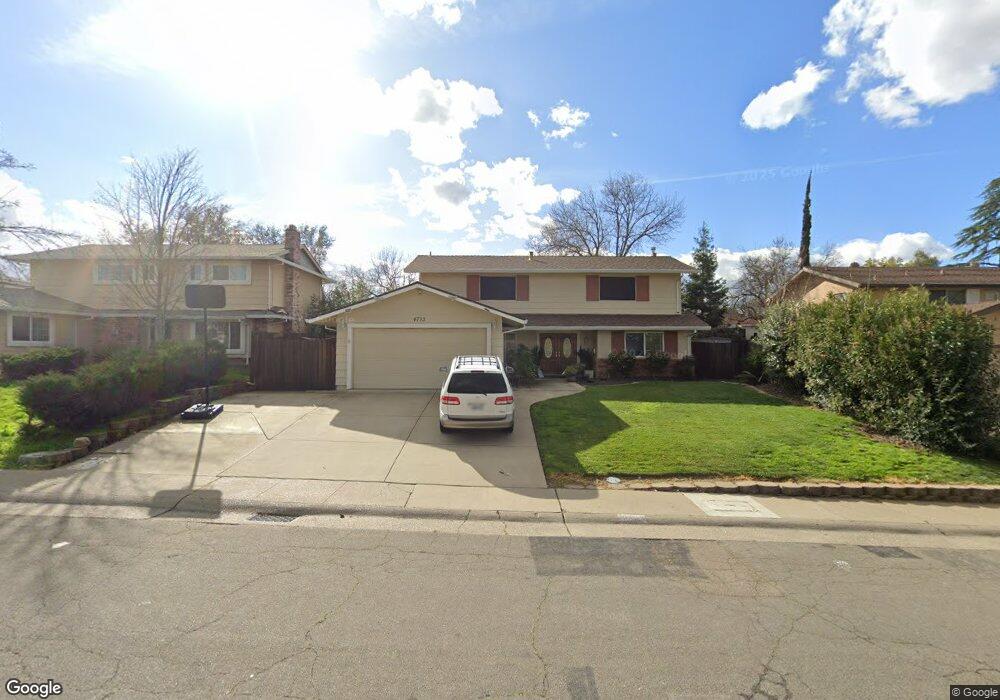
4733 Rustic Rd Fair Oaks, CA 95628
Estimated Value: $381,000 - $620,000
5
Beds
3
Baths
1,889
Sq Ft
$286/Sq Ft
Est. Value
About This Home
This home is located at 4733 Rustic Rd, Fair Oaks, CA 95628 and is currently estimated at $540,995, approximately $286 per square foot. 4733 Rustic Rd is a home located in Sacramento County with nearby schools including Thomas Kelly Elementary School, John Barrett Middle School, and Del Campo High School.
Ownership History
Date
Name
Owned For
Owner Type
Purchase Details
Closed on
Nov 27, 2000
Sold by
Rasmussen Eric D and Rasmussen Tina
Bought by
Alindogan Engelbert and Alindogan Maria Teresa
Current Estimated Value
Home Financials for this Owner
Home Financials are based on the most recent Mortgage that was taken out on this home.
Original Mortgage
$149,600
Outstanding Balance
$55,764
Interest Rate
7.86%
Estimated Equity
$485,231
Purchase Details
Closed on
Mar 27, 1999
Sold by
Rasmussen Eric D
Bought by
Rasmussen Eric D and Rasmussen Tina
Home Financials for this Owner
Home Financials are based on the most recent Mortgage that was taken out on this home.
Original Mortgage
$128,881
Interest Rate
6.79%
Mortgage Type
FHA
Purchase Details
Closed on
Apr 11, 1997
Sold by
Swanner Atha L and Swanner Eva C
Bought by
Rasmussen Eric D
Home Financials for this Owner
Home Financials are based on the most recent Mortgage that was taken out on this home.
Original Mortgage
$131,115
Interest Rate
7.86%
Mortgage Type
FHA
Create a Home Valuation Report for This Property
The Home Valuation Report is an in-depth analysis detailing your home's value as well as a comparison with similar homes in the area
Home Values in the Area
Average Home Value in this Area
Purchase History
| Date | Buyer | Sale Price | Title Company |
|---|---|---|---|
| Alindogan Engelbert | $187,000 | Fidelity National Title Co | |
| Rasmussen Eric D | -- | Commonwealth Land Title Co | |
| Rasmussen Eric D | $133,000 | Stewart Title |
Source: Public Records
Mortgage History
| Date | Status | Borrower | Loan Amount |
|---|---|---|---|
| Open | Alindogan Engelbert | $149,600 | |
| Previous Owner | Rasmussen Eric D | $128,881 | |
| Previous Owner | Rasmussen Eric D | $131,115 | |
| Closed | Alindogan Engelbert | $28,050 |
Source: Public Records
Tax History Compared to Growth
Tax History
| Year | Tax Paid | Tax Assessment Tax Assessment Total Assessment is a certain percentage of the fair market value that is determined by local assessors to be the total taxable value of land and additions on the property. | Land | Improvement |
|---|---|---|---|---|
| 2025 | $3,259 | $281,755 | $60,260 | $221,495 |
| 2024 | $3,259 | $276,231 | $59,079 | $217,152 |
| 2023 | $3,206 | $270,816 | $57,921 | $212,895 |
| 2022 | $3,140 | $265,507 | $56,786 | $208,721 |
| 2021 | $3,087 | $260,302 | $55,673 | $204,629 |
| 2020 | $3,028 | $257,634 | $55,103 | $202,531 |
| 2019 | $2,966 | $252,583 | $54,023 | $198,560 |
| 2018 | $2,930 | $247,631 | $52,964 | $194,667 |
| 2017 | $2,900 | $242,776 | $51,926 | $190,850 |
| 2016 | $2,707 | $238,016 | $50,908 | $187,108 |
| 2015 | $2,705 | $234,442 | $50,144 | $184,298 |
| 2014 | $2,648 | $229,850 | $49,162 | $180,688 |
Source: Public Records
Map
Nearby Homes
- 4836 Rockland Way
- 4722 Papaya Dr
- 4614 Charleston Dr
- 6744 Will Rogers Dr
- 6836 Westmore Way
- 4659 Ladera Way
- 4515 Charleston Dr
- 6716 Oaklawn Way
- 6704 Oaklawn Way
- 7072 Cardinal Rd
- 4605 Ladera Way
- 4704 Johnson Dr
- 6730 Lakeview Dr
- 6636 Saint James Dr
- 7225 Zelinda Dr
- 7201 Cardinal Rd
- 7012 Robin Rd
- 5021 Hillridge Way
- 4509 Olivegate Dr
- 5061 Dewey Dr
- 4729 Rustic Rd
- 4737 Rustic Rd
- 4716 Dewey Orchard Ct
- 4741 Rustic Rd
- 4736 Rustic Rd
- 4720 Dewey Orchard Ct
- 4725 Rustic Rd
- 4712 Dewey Orchard Ct
- 4740 Rustic Rd
- 4732 Rustic Rd
- 4745 Rustic Rd
- 4708 Dewey Orchard Ct
- 4728 Rustic Rd
- 7040 Ellsworth Cir
- 4744 Rustic Rd
- 4700 Orono Ct
- 6901 Ellsworth Cir
- 4804 Rockland Way
- 4749 Rustic Rd
- 4704 Dewey Orchard Ct