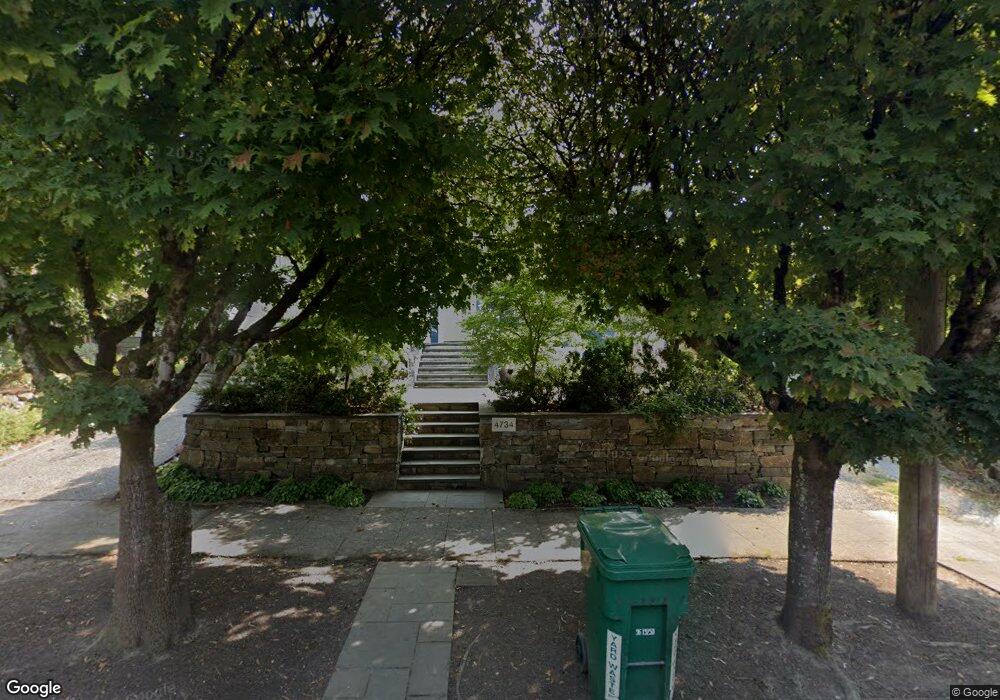
4734 2nd Ave NE Unit Upper Seattle, WA 98105
Wallingford NeighborhoodEstimated Value: $1,288,551 - $1,833,000
3
Beds
2
Baths
1,240
Sq Ft
$1,204/Sq Ft
Est. Value
About This Home
This home is located at 4734 2nd Ave NE Unit Upper, Seattle, WA 98105 and is currently estimated at $1,492,888, approximately $1,203 per square foot. 4734 2nd Ave NE Unit Upper is a home located in King County with nearby schools including Green Lake Elementary School, Hamilton International Middle School, and Lincoln High School.
Ownership History
Date
Name
Owned For
Owner Type
Purchase Details
Closed on
Oct 19, 2017
Sold by
Olejar Michael
Bought by
Barrows Maximilian and White Lauren E
Current Estimated Value
Home Financials for this Owner
Home Financials are based on the most recent Mortgage that was taken out on this home.
Original Mortgage
$944,000
Outstanding Balance
$787,658
Interest Rate
3.78%
Mortgage Type
New Conventional
Estimated Equity
$705,230
Purchase Details
Closed on
Dec 30, 2016
Sold by
Baker William A
Bought by
Olejar Michael
Purchase Details
Closed on
Dec 29, 2016
Sold by
Herzanova Maria and Olejar Michael
Bought by
Olejar Michael
Purchase Details
Closed on
Feb 14, 1997
Sold by
Lockwood Linda M
Bought by
Baker William A
Home Financials for this Owner
Home Financials are based on the most recent Mortgage that was taken out on this home.
Original Mortgage
$88,500
Interest Rate
7.74%
Create a Home Valuation Report for This Property
The Home Valuation Report is an in-depth analysis detailing your home's value as well as a comparison with similar homes in the area
Home Values in the Area
Average Home Value in this Area
Purchase History
| Date | Buyer | Sale Price | Title Company |
|---|---|---|---|
| Barrows Maximilian | $1,180,000 | Chicago Title Company Of Wa | |
| Olejar Michael | $572,000 | Chicago Title | |
| Olejar Michael | -- | Chicago Title | |
| Baker William A | -- | Commonwealth Land Title Ins |
Source: Public Records
Mortgage History
| Date | Status | Borrower | Loan Amount |
|---|---|---|---|
| Open | Barrows Maximilian | $944,000 | |
| Previous Owner | Baker William A | $88,500 |
Source: Public Records
Tax History
| Year | Tax Paid | Tax Assessment Tax Assessment Total Assessment is a certain percentage of the fair market value that is determined by local assessors to be the total taxable value of land and additions on the property. | Land | Improvement |
|---|---|---|---|---|
| 2024 | $11,698 | $1,208,000 | $687,000 | $521,000 |
| 2023 | $10,661 | $1,157,000 | $674,000 | $483,000 |
| 2022 | $9,993 | $1,250,000 | $613,000 | $637,000 |
| 2021 | $10,304 | $1,077,000 | $540,000 | $537,000 |
| 2020 | $10,334 | $1,057,000 | $439,000 | $618,000 |
| 2018 | $6,928 | $1,105,000 | $462,000 | $643,000 |
| 2017 | $6,102 | $686,000 | $405,000 | $281,000 |
| 2016 | $5,678 | $624,000 | $368,000 | $256,000 |
| 2015 | $4,843 | $567,000 | $335,000 | $232,000 |
| 2014 | -- | $493,000 | $301,000 | $192,000 |
| 2013 | -- | $433,000 | $265,000 | $168,000 |
Source: Public Records
Map
Nearby Homes
- 106 NE 46th St
- 4510 Thackeray Place NE
- 4748 4th Ave NE
- 4511 1st Ave NE
- 4509 Eastern Ave N Unit 1-3
- 341 NE 51st St
- 5019 5th Ave NE
- 4521 Sunnyside Ave N Unit A
- 4517B Sunnyside Ave N
- 4515 Sunnyside Ave N Unit B
- 4421 2nd Ave NE
- 4418 1st Ave NE Unit A
- 4406 1st Ave NE
- 4410 Eastern Ave N
- 104 NE 44th St
- 340 NE 53rd St
- 4616 Meridian Ave N
- 4422 Bagley Ave N Unit 108
- 5016 7th Ave NE
- 4709 8th Ave NE
- 4734 2nd Ave NE
- 4730 2nd Ave NE
- 4738 2nd Ave NE
- 4742 2nd Ave NE
- 4726 2nd Ave NE
- 4735 Thackeray Place NE
- 4731 Thackeray Place NE
- 4739 Thackeray Place NE
- 4722 2nd Ave NE
- 4746 2nd Ave NE
- 4727 Thackeray Place NE
- 4741 Thackeray Place NE
- 4723 Thackeray Place NE
- 4750 2nd Ave NE
- 4718 2nd Ave NE
- 4733 2nd Ave NE
- 4729 2nd Ave NE
- 4741 2nd Ave NE
- 4725 2nd Ave NE
- 4719 Thackeray Place NE
Your Personal Tour Guide
Ask me questions while you tour the home.