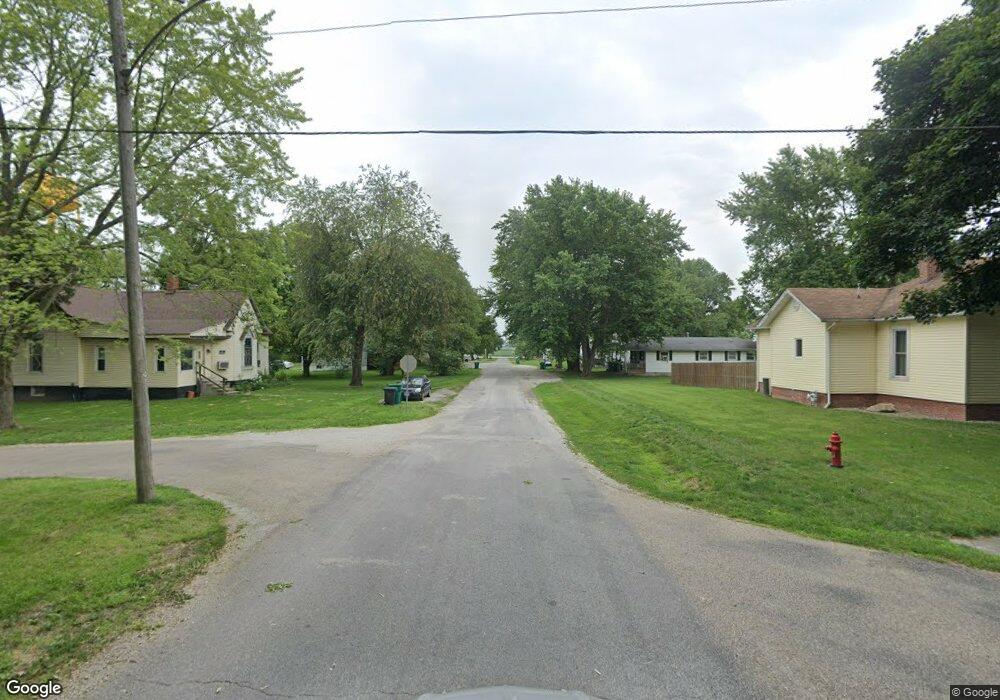
474 E North St Niantic, IL 62551
Estimated Value: $126,000 - $182,000
3
Beds
2
Baths
1,225
Sq Ft
$125/Sq Ft
Est. Value
About This Home
This home is located at 474 E North St, Niantic, IL 62551 and is currently estimated at $153,391, approximately $125 per square foot. 474 E North St is a home located in Macon County.
Ownership History
Date
Name
Owned For
Owner Type
Purchase Details
Closed on
Apr 12, 2024
Sold by
Miller Carli J
Bought by
Reed Jeremy
Current Estimated Value
Home Financials for this Owner
Home Financials are based on the most recent Mortgage that was taken out on this home.
Original Mortgage
$136,800
Outstanding Balance
$134,779
Interest Rate
6.94%
Mortgage Type
New Conventional
Estimated Equity
$18,612
Purchase Details
Closed on
Jul 7, 2014
Sold by
State Bank Of Niantic and Burge David L
Bought by
Miller Carli J
Purchase Details
Closed on
Feb 4, 2014
Sold by
Zienkosky John J and Register Dawn
Bought by
State Bank Of Niantic
Purchase Details
Closed on
Jun 2, 2005
Sold by
Ziekosky Laura L
Bought by
Zienkosky John J
Create a Home Valuation Report for This Property
The Home Valuation Report is an in-depth analysis detailing your home's value as well as a comparison with similar homes in the area
Purchase History
| Date | Buyer | Sale Price | Title Company |
|---|---|---|---|
| Reed Jeremy | $144,000 | None Listed On Document | |
| Miller Carli J | $26,250 | None Available | |
| State Bank Of Niantic | $30,000 | None Available | |
| Zienkosky John J | -- | None Available |
Source: Public Records
Mortgage History
| Date | Status | Borrower | Loan Amount |
|---|---|---|---|
| Open | Reed Jeremy | $136,800 |
Source: Public Records
Tax History Compared to Growth
Tax History
| Year | Tax Paid | Tax Assessment Tax Assessment Total Assessment is a certain percentage of the fair market value that is determined by local assessors to be the total taxable value of land and additions on the property. | Land | Improvement |
|---|---|---|---|---|
| 2024 | $1,885 | $28,261 | $3,416 | $24,845 |
| 2023 | $1,463 | $23,535 | $3,303 | $20,232 |
| 2022 | $1,364 | $21,765 | $3,055 | $18,710 |
| 2021 | $1,314 | $20,673 | $2,901 | $17,772 |
| 2020 | $1,227 | $19,480 | $2,733 | $16,747 |
| 2019 | $1,227 | $19,480 | $2,733 | $16,747 |
| 2018 | $1,198 | $19,018 | $2,668 | $16,350 |
| 2017 | $1,220 | $19,098 | $2,679 | $16,419 |
| 2016 | $1,225 | $19,075 | $2,676 | $16,399 |
| 2015 | $1,718 | $18,519 | $2,598 | $15,921 |
| 2014 | $1,120 | $18,335 | $2,572 | $15,763 |
| 2013 | $1,241 | $18,335 | $2,572 | $15,763 |
Source: Public Records
Map
Nearby Homes
- 360 N Main St
- 223 W Montgomery St
- 0 Bill Wall Dr
- 1359 S Bridge Rd
- 13505 W Long Point Rd
- 917 Miles St Unit 1
- 420 6th St
- 414 5th St
- 275 N Camp St
- 7885 W Wood St
- 0 W Wood St
- 0 W Harristown Blvd Unit 6251050
- 113 Prairie Run
- 5595 W Main St
- 5212 W Main St
- 3335 Nevada Rd
- 210 N Kiick St
- 1720 N Sunnyside Rd
- 155 S Sunnyside Rd
- 1650 N Sunnyside Rd
- 492 E North St
- 456 E North St
- 454 East St
- 454 E North St
- 439 E Montgomery St
- 413 E North St
- 423 E Montgomery St
- 289 N Illinois St
- 407 E Montgomery St
- 454 E Lewis St
- 396 E North St
- 450 E Montgomery St
- 175 N Abbott St
- 384 E North St
- 325 N Illinois St
- 395 E Montgomery St
- 420 E Montgomery St
- 372 E North St
- 406 E Montgomery St
- 396 E Montgomery St
