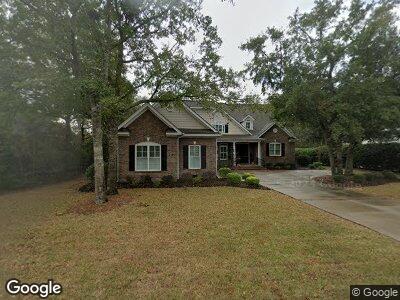
474 Reserve Dr Unit THE RESERVE Pawleys Island, SC 29585
Estimated Value: $1,094,620 - $1,313,000
4
Beds
4
Baths
4,901
Sq Ft
$249/Sq Ft
Est. Value
About This Home
This home is located at 474 Reserve Dr Unit THE RESERVE, Pawleys Island, SC 29585 and is currently estimated at $1,221,405, approximately $249 per square foot. 474 Reserve Dr Unit THE RESERVE is a home located in Georgetown County with nearby schools including Waccamaw Elementary School, Waccamaw Intermediate School, and Waccamaw Middle School.
Ownership History
Date
Name
Owned For
Owner Type
Purchase Details
Closed on
Mar 31, 2021
Sold by
Newman Theodore W and Newman Laura A
Bought by
Loos Mark Edward and Loos Tara Carney
Current Estimated Value
Home Financials for this Owner
Home Financials are based on the most recent Mortgage that was taken out on this home.
Original Mortgage
$90,000
Outstanding Balance
$69,805
Interest Rate
3%
Mortgage Type
New Conventional
Estimated Equity
$1,151,600
Purchase Details
Closed on
Dec 19, 2008
Sold by
Miller Lynn R and Miller Merle W
Bought by
Newman Theodore W and Newman Laura E
Home Financials for this Owner
Home Financials are based on the most recent Mortgage that was taken out on this home.
Original Mortgage
$417,000
Interest Rate
6.1%
Mortgage Type
Purchase Money Mortgage
Purchase Details
Closed on
Aug 27, 1999
Sold by
The Litchfield Company Of Sc Lp
Bought by
Miller Lynn R and Miller Merle W
Create a Home Valuation Report for This Property
The Home Valuation Report is an in-depth analysis detailing your home's value as well as a comparison with similar homes in the area
Home Values in the Area
Average Home Value in this Area
Purchase History
| Date | Buyer | Sale Price | Title Company |
|---|---|---|---|
| Loos Mark Edward | $780,000 | None Available | |
| Newman Theodore W | $695,000 | -- | |
| Miller Lynn R | $79,900 | -- |
Source: Public Records
Mortgage History
| Date | Status | Borrower | Loan Amount |
|---|---|---|---|
| Open | Loos Mark Edward | $90,000 | |
| Previous Owner | Newman Theodore W | $99,000 | |
| Previous Owner | Newman Theodore W | $417,000 | |
| Previous Owner | Newman Theodore W | $417,000 | |
| Previous Owner | Miller Merle W | $183,500 |
Source: Public Records
Tax History Compared to Growth
Tax History
| Year | Tax Paid | Tax Assessment Tax Assessment Total Assessment is a certain percentage of the fair market value that is determined by local assessors to be the total taxable value of land and additions on the property. | Land | Improvement |
|---|---|---|---|---|
| 2024 | $3,687 | $28,750 | $5,200 | $23,550 |
| 2023 | $3,687 | $28,750 | $5,200 | $23,550 |
| 2022 | $3,385 | $28,750 | $5,200 | $23,550 |
| 2021 | $2,504 | $21,768 | $5,200 | $16,568 |
| 2020 | $2,497 | $21,768 | $5,200 | $16,568 |
| 2019 | $2,251 | $19,732 | $3,600 | $16,132 |
| 2018 | $2,299 | $197,320 | $0 | $0 |
| 2017 | $2,042 | $197,320 | $0 | $0 |
| 2016 | $2,017 | $19,732 | $0 | $0 |
| 2015 | $5,903 | $0 | $0 | $0 |
| 2014 | $5,903 | $481,300 | $140,000 | $341,300 |
| 2012 | -- | $481,300 | $140,000 | $341,300 |
Source: Public Records
Map
Nearby Homes
- 179 Cottage Ct
- 70 Golf Club Cir Unit 6
- 44 Hamby Dr
- 77 Tern Place Unit 202
- 915 Preservation Cir
- 820 Preservation Cir
- 41 Federation Loop
- 113 Huntington Lake Cir Unit 128
- 528 Preservation Cir
- 356 Chapman Loop
- 48 Heston Ct
- 297 Huntington Lake Cir Unit 98-F
- 1617 Tradition Club Dr
- 341 Brickwell Ln
- 423 Chapman Loop
- 319 Lumbee Cir Unit The Hammocks at Ming
- TBD Old Cypress Cir Unit Lot 5 Preservation P
- 115 Harbor Club Dr Unit 4A
- 399 Lumbee Cir
- 520 Chapman Loop
- 474 Reserve Dr
- 474 Reserve Dr Unit THE RESERVE
- 474 Reserve Dr Unit 474 The Vintage
- 500 Reserve Dr
- 460 Reserve Dr
- 524 Reserve Dr
- Lot 42 Reserve Dr
- Lot 2 Reserve Dr
- Lot 8 Reserve Dr Unit Gated Golf Community
- Lot 2 Reserve Dr Unit The Reserve
- Lot 5 Reserve Dr
- Lot 42 Reserve Dr Unit The Reserve
- 434 Reserve Dr Unit The Reserve
- 434 Reserve Dr
- 226 Cottage Ct
- 208 Summerhouse Unit 14276 Ocean Highway
- 208 Summerhouse
- 208 Summerhouse Unit 14290 Ocean Highway
- 208 Cottage Ct
- 33 Vintage Dr