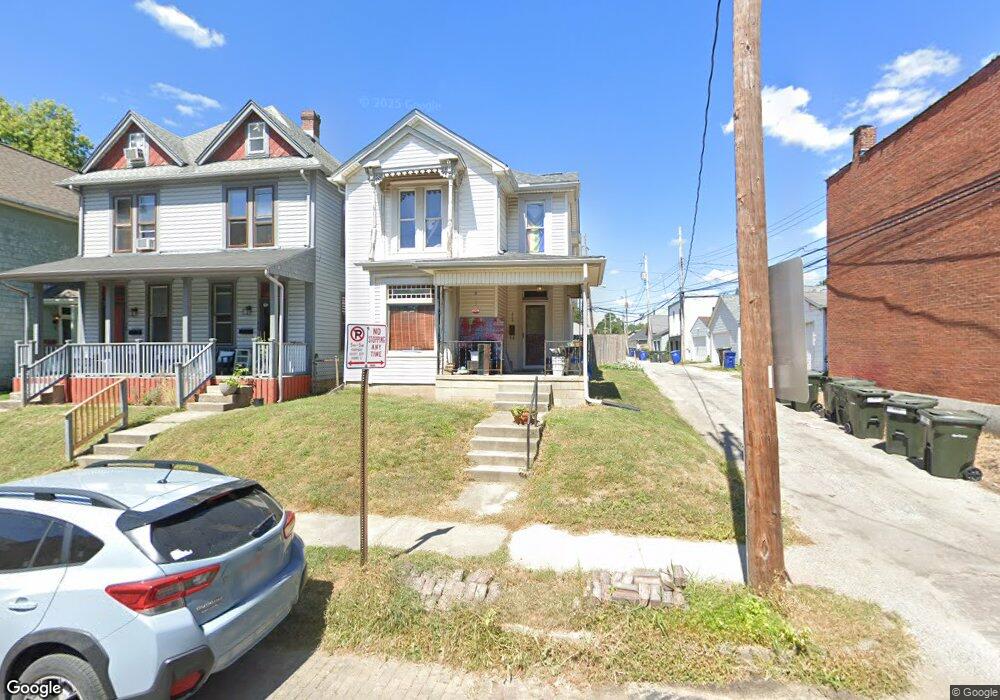
474 W 2nd Ave Columbus, OH 43201
Harrison West NeighborhoodEstimated Value: $476,000 - $607,000
3
Beds
2
Baths
1,770
Sq Ft
$291/Sq Ft
Est. Value
About This Home
This home is located at 474 W 2nd Ave, Columbus, OH 43201 and is currently estimated at $515,642, approximately $291 per square foot. 474 W 2nd Ave is a home located in Franklin County with nearby schools including Hubbard Elementary School, Dominion Middle School, and Whetstone High School.
Ownership History
Date
Name
Owned For
Owner Type
Purchase Details
Closed on
May 11, 2017
Sold by
Yessios Ioannis C
Bought by
Plunkett Andrew D
Current Estimated Value
Home Financials for this Owner
Home Financials are based on the most recent Mortgage that was taken out on this home.
Original Mortgage
$168,750
Outstanding Balance
$138,986
Interest Rate
4.1%
Mortgage Type
New Conventional
Estimated Equity
$376,656
Purchase Details
Closed on
Jul 17, 1998
Sold by
Rosenberg Joshua P
Bought by
Yessios Ioannis C
Home Financials for this Owner
Home Financials are based on the most recent Mortgage that was taken out on this home.
Original Mortgage
$93,000
Interest Rate
7.13%
Purchase Details
Closed on
May 1, 1996
Sold by
Gill Daniel S
Bought by
Joshua P Rosenberg
Home Financials for this Owner
Home Financials are based on the most recent Mortgage that was taken out on this home.
Original Mortgage
$106,340
Interest Rate
7.86%
Mortgage Type
FHA
Purchase Details
Closed on
Sep 4, 1990
Create a Home Valuation Report for This Property
The Home Valuation Report is an in-depth analysis detailing your home's value as well as a comparison with similar homes in the area
Home Values in the Area
Average Home Value in this Area
Purchase History
| Date | Buyer | Sale Price | Title Company |
|---|---|---|---|
| Plunkett Andrew D | $225,000 | None Available | |
| Yessios Ioannis C | $124,000 | Amerititle Agency Inc | |
| Joshua P Rosenberg | $107,000 | -- | |
| -- | $83,400 | -- |
Source: Public Records
Mortgage History
| Date | Status | Borrower | Loan Amount |
|---|---|---|---|
| Open | Plunkett Andrew D | $168,750 | |
| Previous Owner | Yessios Ioannis C | $93,000 | |
| Previous Owner | Joshua P Rosenberg | $106,340 |
Source: Public Records
Tax History
| Year | Tax Paid | Tax Assessment Tax Assessment Total Assessment is a certain percentage of the fair market value that is determined by local assessors to be the total taxable value of land and additions on the property. | Land | Improvement |
|---|---|---|---|---|
| 2025 | $6,349 | $138,540 | $64,410 | $74,130 |
| 2024 | $6,349 | $138,540 | $64,410 | $74,130 |
| 2023 | $6,270 | $138,540 | $64,410 | $74,130 |
| 2022 | $5,593 | $105,250 | $44,910 | $60,340 |
| 2021 | $5,603 | $105,250 | $44,910 | $60,340 |
| 2020 | $5,612 | $105,250 | $44,910 | $60,340 |
| 2019 | $4,848 | $77,960 | $33,260 | $44,700 |
| 2018 | $4,943 | $77,960 | $33,260 | $44,700 |
| 2017 | $4,847 | $77,960 | $33,260 | $44,700 |
| 2016 | $5,539 | $80,790 | $17,050 | $63,740 |
| 2015 | $4,997 | $80,790 | $17,050 | $63,740 |
| 2014 | $5,009 | $80,790 | $17,050 | $63,740 |
| 2013 | $1,440 | $47,075 | $6,755 | $40,320 |
Source: Public Records
Map
Nearby Homes
- 1029 Michigan Ave
- 537 W 3rd Ave Unit 537
- 1176 Perry St Unit 1176
- 0 Bradley St
- 387 W 2nd Ave
- 399 W 2nd Ave
- 1153 Pennsylvania Ave
- 526 W 1st Ave Unit 528
- 496 W 1st Ave
- 998 Perry St Unit 5
- 514 W 1st Ave
- 1149 Harrison Ave
- 502 Riverfront Ln
- 994 Harrison Ave
- 512 Riverfront Ln
- 937 Ingleside Ave Unit 937
- 319 W 2nd Ave Unit 319
- 516 Riverfront Ln
- 925 Ingleside Ave Unit 207
- 925 Ingleside Ave Unit 311
- 478 W 2nd Ave Unit 480
- 482 W 2nd Ave
- 470 W 2nd Ave Unit 470
- 1057 Michigan Ave
- 1059 Michigan Ave
- 488 W 2nd Ave
- 468 W 2nd Ave Unit 468
- 466 W 2nd Ave Unit 466
- 1067 Michigan Ave
- 464 W 2nd Ave Unit 464
- 1078 Oregon Ave Unit 80
- 1071 Michigan Ave
- 1055 Michigan Ave Unit 1055
- 1069 Michigan Ave
- 1053 Michigan Ave Unit 1053
- 1084 Oregon Ave
- 1075 Michigan Ave
- 1073 Michigan Ave Unit 75
- 1041 Michigan Ave
- 1077 Michigan Ave
Your Personal Tour Guide
Ask me questions while you tour the home.