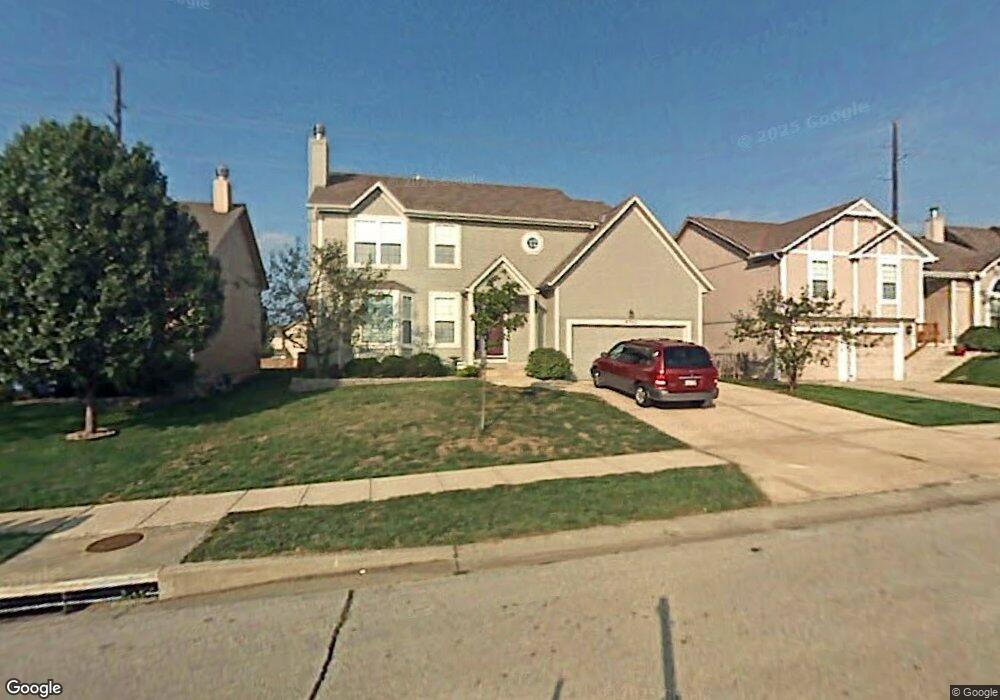
4742 Mund Rd Shawnee, KS 66218
Estimated Value: $416,146 - $435,000
4
Beds
3
Baths
1,888
Sq Ft
$226/Sq Ft
Est. Value
About This Home
This home is located at 4742 Mund Rd, Shawnee, KS 66218 and is currently estimated at $427,537, approximately $226 per square foot. 4742 Mund Rd is a home located in Johnson County with nearby schools including Riverview Elementary School, Mill Creek Middle School, and Mill Valley High School.
Ownership History
Date
Name
Owned For
Owner Type
Purchase Details
Closed on
May 16, 2011
Sold by
Federal Home Loan Mortgage Corporation
Bought by
Leuthold Eric and Leuthold Aditi
Current Estimated Value
Home Financials for this Owner
Home Financials are based on the most recent Mortgage that was taken out on this home.
Original Mortgage
$134,400
Outstanding Balance
$92,449
Interest Rate
4.66%
Mortgage Type
New Conventional
Estimated Equity
$335,088
Purchase Details
Closed on
Feb 16, 2010
Sold by
Pemberton Rance E and Pemberton Angela L
Bought by
Federal Home Loan Mortgage Corporation
Purchase Details
Closed on
Mar 25, 2002
Sold by
Townsend Dirk L and Townsend Jamie M
Bought by
Pemberton Rance E and Pemberton Angela L
Home Financials for this Owner
Home Financials are based on the most recent Mortgage that was taken out on this home.
Original Mortgage
$186,200
Interest Rate
6.83%
Create a Home Valuation Report for This Property
The Home Valuation Report is an in-depth analysis detailing your home's value as well as a comparison with similar homes in the area
Home Values in the Area
Average Home Value in this Area
Purchase History
| Date | Buyer | Sale Price | Title Company |
|---|---|---|---|
| Leuthold Eric | $168,000 | Servicelink | |
| Federal Home Loan Mortgage Corporation | $194,807 | Continental Title Company | |
| Pemberton Rance E | -- | Security Land Title Company |
Source: Public Records
Mortgage History
| Date | Status | Borrower | Loan Amount |
|---|---|---|---|
| Open | Leuthold Eric | $134,400 | |
| Previous Owner | Pemberton Rance E | $186,200 |
Source: Public Records
Tax History Compared to Growth
Tax History
| Year | Tax Paid | Tax Assessment Tax Assessment Total Assessment is a certain percentage of the fair market value that is determined by local assessors to be the total taxable value of land and additions on the property. | Land | Improvement |
|---|---|---|---|---|
| 2024 | $4,947 | $42,642 | $9,019 | $33,623 |
| 2023 | $4,739 | $40,330 | $8,198 | $32,132 |
| 2022 | $4,480 | $37,352 | $7,450 | $29,902 |
| 2021 | $4,212 | $33,706 | $7,100 | $26,606 |
| 2020 | $3,790 | $30,038 | $5,917 | $24,121 |
| 2019 | $3,730 | $29,130 | $5,635 | $23,495 |
| 2018 | $3,444 | $26,646 | $5,635 | $21,011 |
| 2017 | $3,395 | $25,622 | $4,900 | $20,722 |
| 2016 | $3,265 | $24,334 | $4,457 | $19,877 |
| 2015 | $2,696 | $19,814 | $4,457 | $15,357 |
| 2013 | -- | $18,745 | $4,457 | $14,288 |
Source: Public Records
Map
Nearby Homes
- 4713 Lone Elm
- 21222 W 48th St
- 4754 Lakecrest Dr
- 21408 W 50th St
- 22014 W 47th Terrace
- 4531 Woodstock St
- 21525 W 51st St
- 20823 W 45th Terrace
- 22014 W 51st St
- 5116 Payne St
- 5015 Millbrook St
- 5005 Hilltop Dr
- 21804 W 52nd Terrace
- 4638 Aminda St
- 22115 W 51st Terrace
- 5206 Round Prairie St
- 5307 Noble St
- 5311 Brownridge Dr
- 22611 W 46th Terrace
- 9307 Aminda St