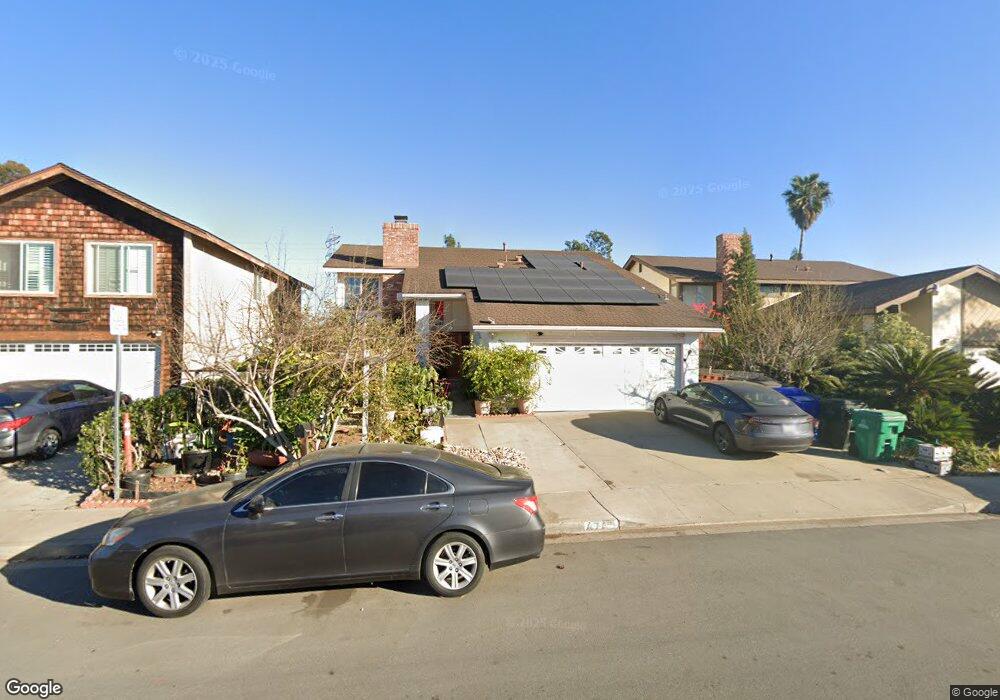
4745 Cannington Dr San Diego, CA 92117
Clairemont Mesa East NeighborhoodEstimated Value: $1,359,000 - $1,438,000
5
Beds
3
Baths
2,348
Sq Ft
$600/Sq Ft
Est. Value
About This Home
This home is located at 4745 Cannington Dr, San Diego, CA 92117 and is currently estimated at $1,407,923, approximately $599 per square foot. 4745 Cannington Dr is a home located in San Diego County with nearby schools including Lafayette Elementary, Innovation Middle School, and Madison High School.
Ownership History
Date
Name
Owned For
Owner Type
Purchase Details
Closed on
Nov 20, 2011
Sold by
Tran Tracy Thi
Bought by
Nguyen Tom T and Tran Tracy T
Current Estimated Value
Purchase Details
Closed on
Dec 18, 2009
Sold by
Nguyen Tom Thanh
Bought by
Tran Tracy Thi
Purchase Details
Closed on
May 14, 2005
Sold by
Vanvantran Hang Van and Tran Helena My
Bought by
Tran Helena My and Tran Tracy Thi
Purchase Details
Closed on
Mar 2, 2000
Sold by
Bacon Crystal
Bought by
Vanvantran Hang Van and Tran Helena My
Home Financials for this Owner
Home Financials are based on the most recent Mortgage that was taken out on this home.
Original Mortgage
$102,000
Outstanding Balance
$34,693
Interest Rate
8.34%
Estimated Equity
$1,373,230
Purchase Details
Closed on
Nov 3, 1999
Sold by
Truntz Richard J and Truntz Joann T
Bought by
Bacon Crystal
Home Financials for this Owner
Home Financials are based on the most recent Mortgage that was taken out on this home.
Original Mortgage
$187,250
Interest Rate
5.45%
Create a Home Valuation Report for This Property
The Home Valuation Report is an in-depth analysis detailing your home's value as well as a comparison with similar homes in the area
Home Values in the Area
Average Home Value in this Area
Purchase History
| Date | Buyer | Sale Price | Title Company |
|---|---|---|---|
| Nguyen Tom T | -- | None Available | |
| Tran Tracy Thi | -- | None Available | |
| Tran Tracy Thi | -- | None Available | |
| Tran Helena My | -- | -- | |
| Vanvantran Hang Van | $282,000 | Fidelity National Title | |
| Bacon Crystal | $267,500 | Guardian Title Company |
Source: Public Records
Mortgage History
| Date | Status | Borrower | Loan Amount |
|---|---|---|---|
| Open | Vanvantran Hang Van | $102,000 | |
| Previous Owner | Bacon Crystal | $187,250 |
Source: Public Records
Tax History Compared to Growth
Tax History
| Year | Tax Paid | Tax Assessment Tax Assessment Total Assessment is a certain percentage of the fair market value that is determined by local assessors to be the total taxable value of land and additions on the property. | Land | Improvement |
|---|---|---|---|---|
| 2025 | $6,685 | $552,300 | $292,383 | $259,917 |
| 2024 | $6,685 | $541,471 | $286,650 | $254,821 |
| 2023 | $6,537 | $530,855 | $281,030 | $249,825 |
| 2022 | $6,363 | $520,447 | $275,520 | $244,927 |
| 2021 | $6,320 | $510,243 | $270,118 | $240,125 |
| 2020 | $6,244 | $505,012 | $267,349 | $237,663 |
| 2019 | $6,133 | $495,110 | $262,107 | $233,003 |
| 2018 | $5,734 | $485,403 | $256,968 | $228,435 |
| 2017 | $5,598 | $475,886 | $251,930 | $223,956 |
| 2016 | $5,508 | $466,556 | $246,991 | $219,565 |
| 2015 | $5,427 | $459,548 | $243,281 | $216,267 |
| 2014 | $5,342 | $450,547 | $238,516 | $212,031 |
Source: Public Records
Map
Nearby Homes
- 5656 Chandler Dr
- 5768 Camber Dr
- 5715 Castleton Dr
- 5783 Camber Dr
- 4410 Charger Blvd
- 6460 Convoy Ct Unit SPC 59
- 6460 Convoy Ct Unit 185
- 6460 Convoy Ct Unit SPC 318
- 6939 Bettyhill Dr
- 6750 Beadnell Way Unit 3
- 4261 Cannington Dr
- 6602 Beadnell Way Unit 13
- 6666 Beadnell Way Unit 9
- 6666 Beadnell Way Unit 15
- 5404 Balboa Arms Dr Unit 461
- 6333 Mount Ada Rd Unit 278
- 6333 Mount Ada Rd Unit 258
- 6333 Mount Ada Rd Unit 156
- 5402 Balboa Arms Dr Unit 345
- 5170 Clairemont Mesa Blvd Unit 8
- 4735 Cannington Dr
- 4755 Cannington Dr
- 6360 Hannon Ct
- 4765 Cannington Dr
- 6346 Hannon Ct
- 6332 Hannon Ct
- 6374 Hannon Ct
- 4750 Cannington Dr
- 4760 Cannington Dr
- 4740 Cannington Dr
- 4775 Cannington Dr
- 4732 Cannington Dr
- 4768 Cannington Dr
- 4778 Cannington Dr
- 6318 Hannon Ct
- 6388 Hannon Ct
- 6220 Hannon Ct
- 4788 Cannington Dr
- 6230 Hannon Ct
- 6304 Hannon Ct