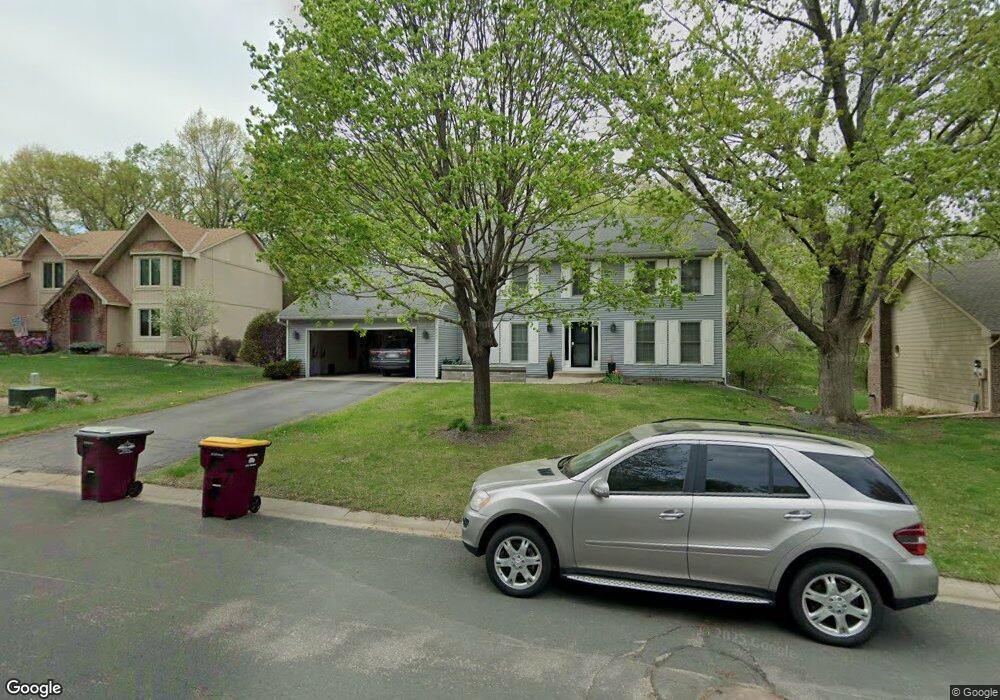
4747 Burr Oak St Saint Paul, MN 55122
Estimated Value: $567,642 - $613,000
5
Beds
4
Baths
3,454
Sq Ft
$170/Sq Ft
Est. Value
About This Home
This home is located at 4747 Burr Oak St, Saint Paul, MN 55122 and is currently estimated at $588,161, approximately $170 per square foot. 4747 Burr Oak St is a home located in Dakota County with nearby schools including Oak Ridge Elementary School, Black Hawk Middle School, and Eastview Senior High School.
Ownership History
Date
Name
Owned For
Owner Type
Purchase Details
Closed on
May 18, 2021
Sold by
Smith James T and Smith Leeann C
Bought by
Casey Kevin and Casey Blair
Current Estimated Value
Home Financials for this Owner
Home Financials are based on the most recent Mortgage that was taken out on this home.
Original Mortgage
$412,000
Outstanding Balance
$373,375
Interest Rate
3.1%
Mortgage Type
New Conventional
Estimated Equity
$214,786
Purchase Details
Closed on
Sep 30, 2010
Sold by
Conway Beth A and Conway James P
Bought by
Smith James T and Schirmer Leeann C
Home Financials for this Owner
Home Financials are based on the most recent Mortgage that was taken out on this home.
Original Mortgage
$323,641
Interest Rate
2.75%
Mortgage Type
FHA
Purchase Details
Closed on
Jul 30, 1999
Sold by
Albrecht Michael Charles and Albrecht Karen M
Bought by
Conway James P and Conway Beth A
Create a Home Valuation Report for This Property
The Home Valuation Report is an in-depth analysis detailing your home's value as well as a comparison with similar homes in the area
Home Values in the Area
Average Home Value in this Area
Purchase History
| Date | Buyer | Sale Price | Title Company |
|---|---|---|---|
| Casey Kevin | $515,000 | Edina Realty Title Inc | |
| Smith James T | $328,000 | Edina Realty Title | |
| Conway James P | $237,000 | -- |
Source: Public Records
Mortgage History
| Date | Status | Borrower | Loan Amount |
|---|---|---|---|
| Open | Casey Kevin | $412,000 | |
| Previous Owner | Smith James T | $323,641 |
Source: Public Records
Tax History Compared to Growth
Tax History
| Year | Tax Paid | Tax Assessment Tax Assessment Total Assessment is a certain percentage of the fair market value that is determined by local assessors to be the total taxable value of land and additions on the property. | Land | Improvement |
|---|---|---|---|---|
| 2024 | $5,926 | $529,000 | $122,000 | $407,000 |
| 2023 | $5,926 | $538,700 | $122,400 | $416,300 |
| 2022 | $4,908 | $517,000 | $122,000 | $395,000 |
| 2021 | $4,720 | $436,500 | $106,100 | $330,400 |
| 2020 | $4,752 | $409,800 | $101,100 | $308,700 |
| 2019 | $4,265 | $402,100 | $96,200 | $305,900 |
| 2018 | $4,116 | $381,500 | $91,700 | $289,800 |
| 2017 | $4,222 | $357,800 | $87,300 | $270,500 |
| 2016 | $4,182 | $350,400 | $83,100 | $267,300 |
| 2015 | $4,205 | $338,265 | $81,596 | $256,669 |
| 2014 | -- | $334,014 | $79,336 | $254,678 |
| 2013 | -- | $305,129 | $71,304 | $233,825 |
Source: Public Records
Map
Nearby Homes
- 4632 Westwood Ln
- 4774 Slater Rd
- 3309 Red Oak Cir N
- 319 River Woods Ln
- 247 River Woods Ln
- 221 River Woods Ln
- 11902 River Hills Cir
- 188 River Woods Ln
- 145 River Woods Ln
- 146 River Woods Ln
- 11921 Baypoint Dr
- 72 River Woods Ln
- 2100 Viburnum Trail
- 55 River Woods Ln
- 2107 Kings Rd
- 3017 Mcleod St
- 2065 Kings Rd
- 11900 Highland View Cir
- 4463 Cinnamon Ridge Cir
- 4427 Cinnamon Ridge Cir
- 4741 Burr Oak St
- 4753 Burr Oak St
- 4748 White Oak Ct
- 4742 White Oak Ct
- 4756 White Oak Ct
- 4759 Burr Oak St
- 4735 Burr Oak St
- 4744 Burr Oak St
- 4752 Burr Oak St
- 4736 White Oak Ct
- 4762 White Oak Ct
- 2256 Mahogany Way
- 4740 Burr Oak St
- 4765 Burr Oak St
- 4760 Burr Oak St
- 4768 White Oak Ct
- 4730 White Oak Ct
- 2244 Mahogany Way
- 4749 Oak Cliff Dr
- 4743 Oak Cliff Dr