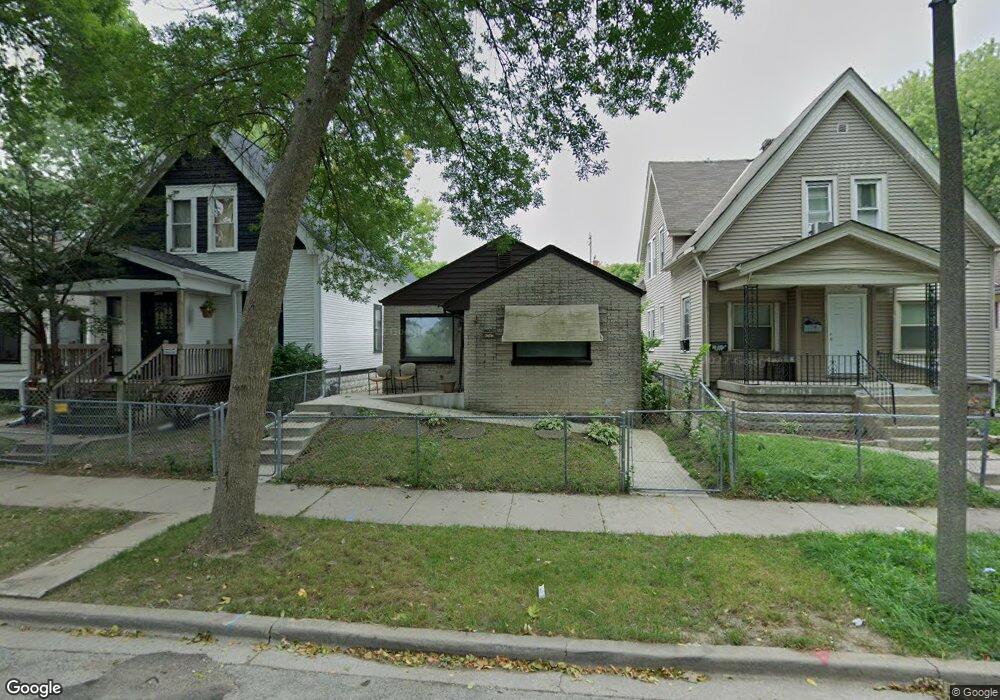
4747 N 36th St Milwaukee, WI 53209
Old North Milwaukee NeighborhoodEstimated Value: $100,000 - $126,898
3
Beds
1
Bath
1,108
Sq Ft
$103/Sq Ft
Est. Value
About This Home
This home is located at 4747 N 36th St, Milwaukee, WI 53209 and is currently estimated at $113,975, approximately $102 per square foot. 4747 N 36th St is a home located in Milwaukee County with nearby schools including Craig Montessori School, La Escuela Fratney, and Milwaukee German Immersion School.
Ownership History
Date
Name
Owned For
Owner Type
Purchase Details
Closed on
Mar 13, 2015
Sold by
Phoenix Capital V Llc
Bought by
Miles Kathy
Current Estimated Value
Purchase Details
Closed on
Feb 2, 2010
Sold by
Stonecrest Income & Opportunity Fund I L
Bought by
Phoenix Capital V Llc
Purchase Details
Closed on
Dec 7, 2009
Sold by
Sb Holdings Llc
Bought by
Stonecrest Income & Opportunity Fund 1 L
Purchase Details
Closed on
Sep 29, 2009
Sold by
Lasalle Bank National Association
Bought by
Sb Holdings Llc
Purchase Details
Closed on
Feb 18, 2009
Sold by
Young Edward C
Bought by
Lasalle Bank National Association
Purchase Details
Closed on
Oct 19, 2005
Sold by
Hughes Joe L and Hughes Lucy B
Bought by
Young Edward C and Young Nicole
Home Financials for this Owner
Home Financials are based on the most recent Mortgage that was taken out on this home.
Original Mortgage
$67,150
Interest Rate
9.35%
Mortgage Type
Fannie Mae Freddie Mac
Create a Home Valuation Report for This Property
The Home Valuation Report is an in-depth analysis detailing your home's value as well as a comparison with similar homes in the area
Home Values in the Area
Average Home Value in this Area
Purchase History
| Date | Buyer | Sale Price | Title Company |
|---|---|---|---|
| Miles Kathy | $20,000 | None Available | |
| Phoenix Capital V Llc | $13,188 | None Available | |
| Stonecrest Income & Opportunity Fund 1 L | $11,100 | None Available | |
| Sb Holdings Llc | $10,600 | None Available | |
| Lasalle Bank National Association | -- | None Available | |
| Young Edward C | $60,000 | -- |
Source: Public Records
Mortgage History
| Date | Status | Borrower | Loan Amount |
|---|---|---|---|
| Previous Owner | Young Edward C | $67,150 |
Source: Public Records
Tax History Compared to Growth
Tax History
| Year | Tax Paid | Tax Assessment Tax Assessment Total Assessment is a certain percentage of the fair market value that is determined by local assessors to be the total taxable value of land and additions on the property. | Land | Improvement |
|---|---|---|---|---|
| 2024 | $3,188 | $95,400 | $3,300 | $92,100 |
| 2023 | $2,108 | $89,200 | $3,300 | $85,900 |
| 2022 | $2,110 | $89,200 | $3,300 | $85,900 |
| 2021 | $2,316 | $51,000 | $3,300 | $47,700 |
| 2020 | $2,254 | $51,000 | $3,300 | $47,700 |
| 2019 | $1,967 | $43,000 | $3,000 | $40,000 |
| 2018 | $2,352 | $43,000 | $3,000 | $40,000 |
| 2017 | $1,693 | $45,200 | $4,500 | $40,700 |
| 2016 | $2,545 | $48,500 | $4,500 | $44,000 |
| 2015 | $2,479 | $48,500 | $4,500 | $44,000 |
| 2014 | -- | $48,500 | $4,500 | $44,000 |
| 2013 | -- | $52,100 | $4,500 | $47,600 |
Source: Public Records
Map
Nearby Homes
- 4720 N 36th St
- 4751 N 35th St
- 4813 N 36th St
- 4661 N 38th St
- 4625 N Hopkins St
- 4644 N 38th St
- 4715 N 39th St
- 3902 W Hampton Ave
- 4571 N Hopkins St
- 4825 N 39th St
- 4624 N 39th St Unit 4626
- 4572 N 38th St
- 4003 W Hampton Ave
- 4836 N 40th St
- 4571 N 39th St
- 4863 N 40th St
- 4576 N 40th St
- 4513 N 37th St
- 4877 N 40th St
- 3733 W Fairmount Ave
- 4741 N 36th St
- 4749 N 36th St
- 4739 N 36th St
- 4759A N 36th St
- 4733 N 36th St
- 4729 N 36th St Unit 4731
- 4761A N 36th St
- 4744 N 37th St
- 4750 N 37th St
- 4727 N 36th St
- 4755 N 36th St
- 4752A N 36th St
- 4758 N 37th St Unit 4760
- 4740 N 37th St
- 4723 N 36th St
- 4746 N 36th St
- 4748 N 36th St
- 4736 N 36th St
- 4740A N 37th St
- 4736A N 37th St