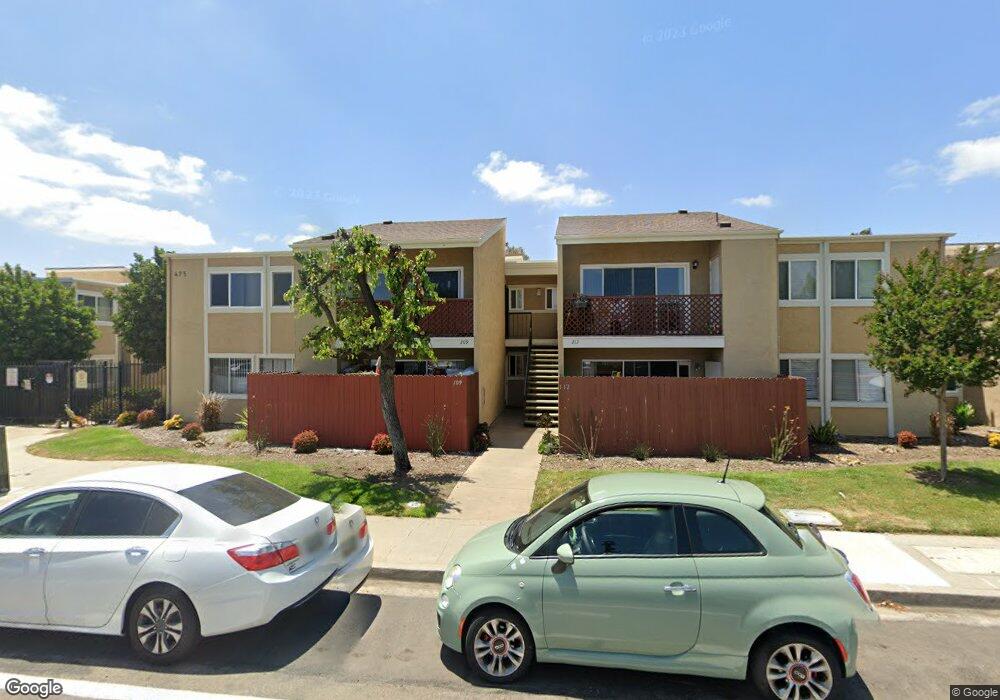
475 N Midway Dr Unit 228 Escondido, CA 92027
Midway NeighborhoodEstimated Value: $315,000 - $410,000
2
Beds
1
Bath
828
Sq Ft
$436/Sq Ft
Est. Value
About This Home
This home is located at 475 N Midway Dr Unit 228, Escondido, CA 92027 and is currently estimated at $361,283, approximately $436 per square foot. 475 N Midway Dr Unit 228 is a home located in San Diego County with nearby schools including Glen View Elementary School, Hidden Valley Middle School, and Orange Glen High School.
Ownership History
Date
Name
Owned For
Owner Type
Purchase Details
Closed on
Feb 11, 2000
Sold by
Beaty Herbert E and Beaty Beverly J
Bought by
Rodriguez Arnulfo and Rodriguez Irma A
Current Estimated Value
Purchase Details
Closed on
Jul 14, 1997
Sold by
Levett and Nancey
Bought by
Beaty Herbert E and Beaty Beverly J
Purchase Details
Closed on
Jun 1, 1995
Sold by
Va
Bought by
Levett Frank and Levett Nancey
Home Financials for this Owner
Home Financials are based on the most recent Mortgage that was taken out on this home.
Original Mortgage
$31,590
Interest Rate
8.37%
Mortgage Type
Seller Take Back
Purchase Details
Closed on
Sep 21, 1994
Sold by
Lincoln Service Corp
Bought by
Va
Purchase Details
Closed on
Jul 30, 1993
Sold by
Bond Thomas P and Bond Sharon K
Bought by
Cochran Brian
Purchase Details
Closed on
Apr 3, 1990
Create a Home Valuation Report for This Property
The Home Valuation Report is an in-depth analysis detailing your home's value as well as a comparison with similar homes in the area
Home Values in the Area
Average Home Value in this Area
Purchase History
| Date | Buyer | Sale Price | Title Company |
|---|---|---|---|
| Rodriguez Arnulfo | $55,000 | Fidelity National Title | |
| Beaty Herbert E | -- | Chicago Title Co | |
| Levett Frank | $35,500 | American Title Insurance Co | |
| Va | -- | Fidelity National Title Ins | |
| Lincoln Service Mtg Corp | $46,181 | Fidelity National Title Ins | |
| Cochran Brian | $60,000 | -- | |
| -- | $60,000 | -- |
Source: Public Records
Mortgage History
| Date | Status | Borrower | Loan Amount |
|---|---|---|---|
| Previous Owner | Levett Frank | $31,590 |
Source: Public Records
Tax History Compared to Growth
Tax History
| Year | Tax Paid | Tax Assessment Tax Assessment Total Assessment is a certain percentage of the fair market value that is determined by local assessors to be the total taxable value of land and additions on the property. | Land | Improvement |
|---|---|---|---|---|
| 2025 | $975 | $84,506 | $24,846 | $59,660 |
| 2024 | $975 | $82,850 | $24,359 | $58,491 |
| 2023 | $953 | $81,227 | $23,882 | $57,345 |
| 2022 | $943 | $79,635 | $23,414 | $56,221 |
| 2021 | $928 | $78,074 | $22,955 | $55,119 |
| 2020 | $923 | $77,274 | $22,720 | $54,554 |
| 2019 | $901 | $75,760 | $22,275 | $53,485 |
| 2018 | $877 | $74,276 | $21,839 | $52,437 |
| 2017 | $862 | $72,820 | $21,411 | $51,409 |
| 2016 | $845 | $71,393 | $20,992 | $50,401 |
| 2015 | $838 | $70,321 | $20,677 | $49,644 |
| 2014 | $805 | $68,944 | $20,272 | $48,672 |
Source: Public Records
Map
Nearby Homes
- 475 N Midway Dr Unit 230
- 475 N Midway Dr Unit 122
- 475 N Midway Dr Unit 139
- 2280 E Valley Pkwy Unit 74
- 2280 E Valley Pkwy Unit 75
- 2300 E Valley Pkwy Unit 173
- 2300 E Valley Pkwy Unit 120
- 2300 E Valley Pkwy Unit 4
- 2300 E Valley Pkwy Unit 84
- 2300 E Valley Pkwy
- 2300 E Valley Pkwy Unit 115
- 2041 E Grand Ave Unit 34
- 2041 E Grand Ave Unit 24
- 2041 E Grand Ave Unit 38
- 2141 E Mission Ave
- 1811 E Grand Ave Unit 175
- 1817 E Grand Ave Unit 77
- 1817 E Grand Ave Unit 6
- 1817 E Grand Ave Unit 56
- 1817 E Grand Ave Unit 63
- 475 N Midway Dr
- 475 N Midway Dr Unit 245
- 475 N Midway Dr Unit 131
- 475 N Midway Dr Unit 239
- 475 N Midway Dr Unit 238
- 475 N Midway Dr Unit 237
- 475 N Midway Dr Unit 236
- 475 N Midway Dr Unit 235
- 475 N Midway Dr Unit 234
- 475 N Midway Dr Unit 233
- 475 N Midway Dr Unit 232
- 475 N Midway Dr Unit 231
- 475 N Midway Dr Unit 229
- 475 N Midway Dr Unit 226
- 475 N Midway Dr Unit 225
- 475 N Midway Dr Unit 224
- 475 N Midway Dr Unit 149
- 475 N Midway Dr Unit 148
- 475 N Midway Dr Unit 147
- 475 N Midway Dr Unit 146